
Figure 3. Uptake of OVA as a model antigen in purified B cells from SMAD−/− mice.
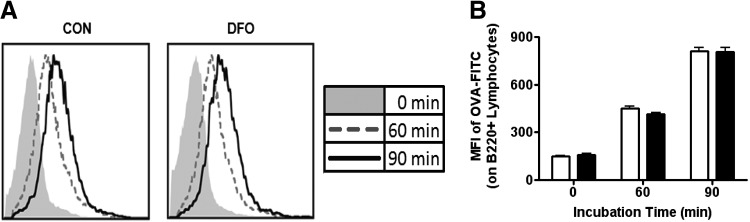
Aliquots of B cells were resuspended with 50 μg/mL OVA conjugated to FITC (OVA-FITC) at 37°C for 0, 60, and 90 min before being placed on ice. Purified B cells were negatively selected from the spleens of SMAD−/− fed the CON (open bars) diet or the DFO (solid bars) diet. (A) Representative histograms displaying the change in fluorescence over time after incubation with OVA-FITC in CON (left)- and DFO (right)-fed SMAD−/− mice B cells. (B) Change in MFI of OVA-FITC on purified B cells over time. Data are represented as mean ± sem; n = 10.