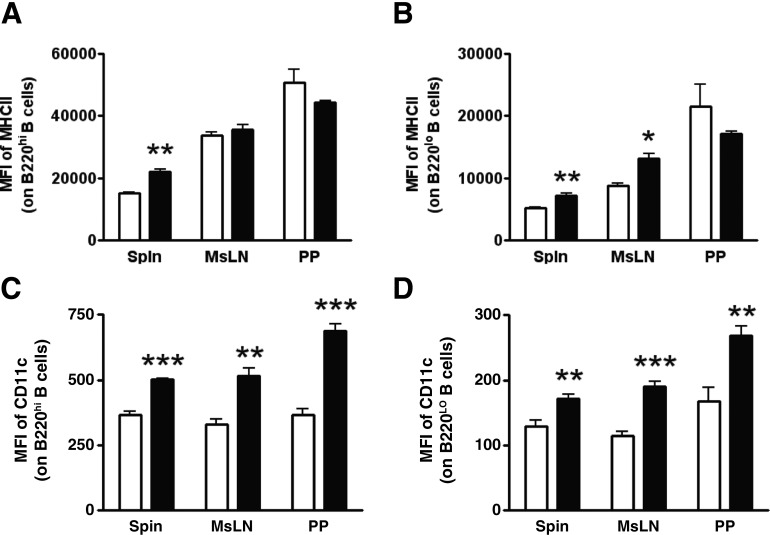
Figure 5. Surface marker expression on B cells from SMAD−/− mice.
An in vivo characterization was performed on the spleen, MsLNs, and PPs of SMAD−/− mice fed the CON (open bars) diet or the DFO (solid bars) diet. The MFI of MHCII and CD11c was determined on B cells, identified as CD8a− Gr1− B220+ MHCII+ lymphocytes. (A) Staining for MHCII on B220hi B cells. (B) Staining for MHCII on B220lo B cells. (C) Staining for CD11c on B220hi B cells. (D) Staining for CD11c on B220lo B cells. Data are represented as mean ± sem; n = 3–5. Data indicate significant differences: *P < 0.05; **P < 0.01; ***P < 0.001.

