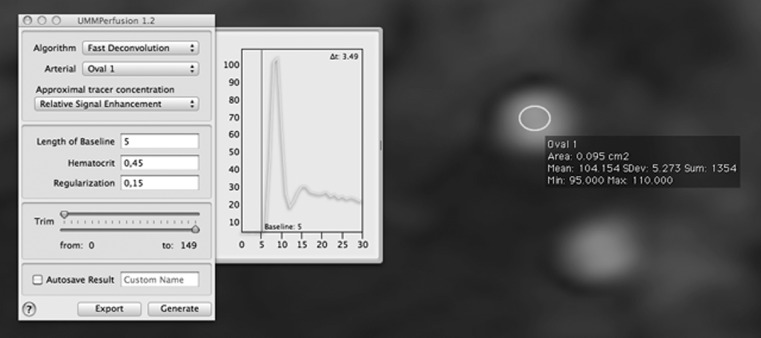
Fig. 2.
Graphical user interface of the perfusion plug-in. The arterial input function (green curve) selected by the user is shown in display window. The plot is updated in real-time when the user changes the corresponding ROI in the image. Also the current setting of the baseline (red line) is depicted

