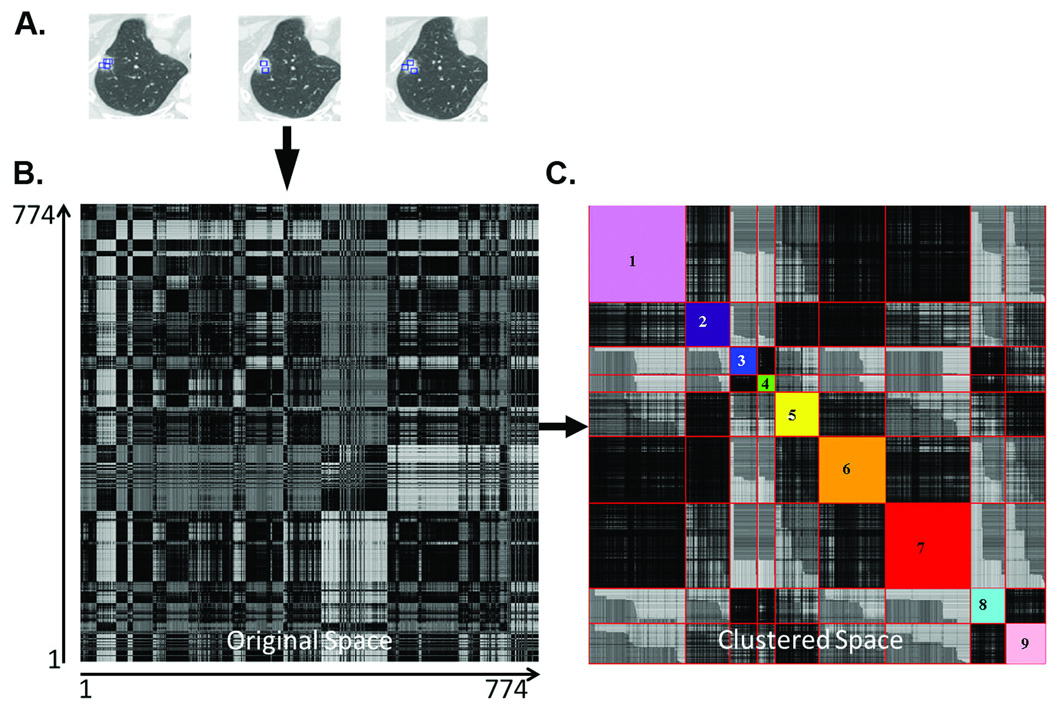
Figure 2.
Natural clustering of HRCT regions of interest (ROI) of lung nodules. Panel A shows representative ROIs selected from different nodules in the training set. Each of the 774 ROI were compared with each other to derive the pairwise 774×774 similarity matrix and color coded (Panel B) such that the darkness is proportional to the similarity. Panel C shows the similarity matrix in the Affinity Propagation based clustered space wherein the arbitrarily color-coded diagonal sub-blocks show the automatically computed natural clusters.

