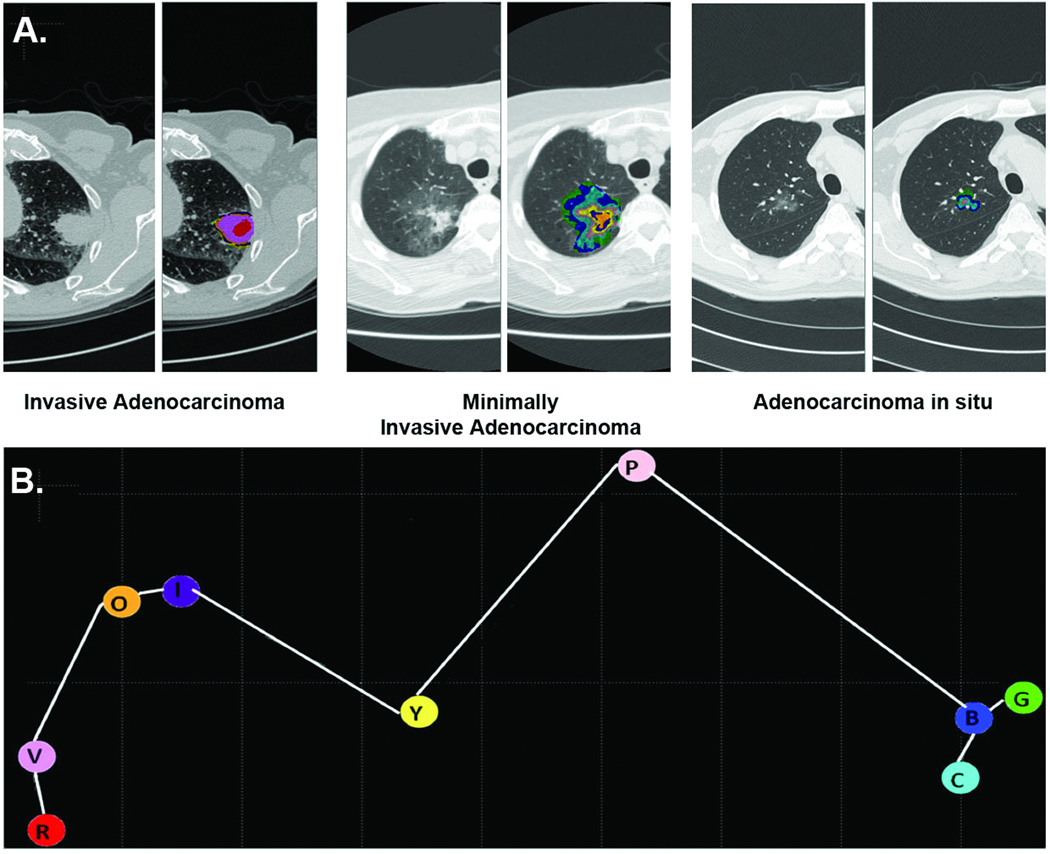
Figure 3.
Representative signatures for invasive adenocarcinoma, minimally invasive adenocarcinoma and adenocarcinoma in situ (Panel A). Representative CT images with the superimposed distribution of the 9 adenocarcinoma exemplars are show for IA, MIA and AIS. Panel B shows the three-dimensional distribution of the 9 adenocarcinoma exemplars using Multi-Dimensional Scaling. It demonstrates the secondary clustering of the exemplars, violet-indigo-red-orange (V-I-R-O) representing invasion, yellow-pink (Y-P) and blue-green-cyan (B-G-C) representing lepidic growth.

