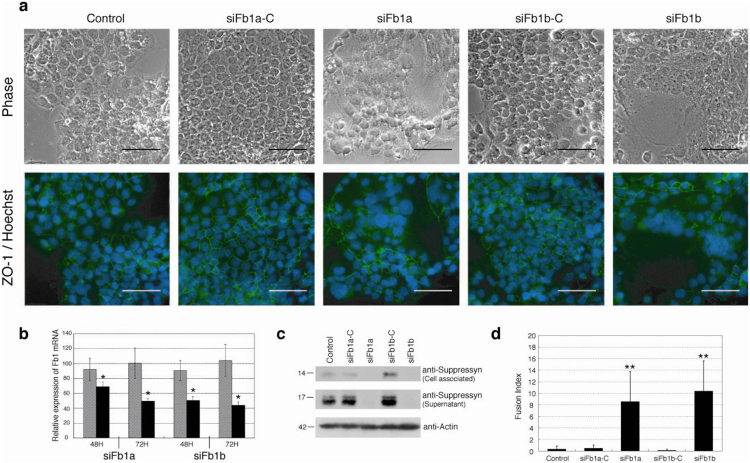
Figure 2. Fb1 knock-down increases cell fusion in syn1 expressing cells.
Fb1-specific mRNA knock-down in BeWo choriocarcinoma cells using distinct siRNA (siFb1a and siFb1b) or their respective scrambled siRNA controls. Fb1 knock down induced a significant increase in cell fusion (a, d). (a) ZO-1-FITC and Hoechst 33342 immunocytochemistry was performed 72 hours after siRNA exposure and images are depicted in the lower row. The upper row shows matched, phase-contrast images. Scale bar represents 100 μm. Quantitative RT-PCR, immunoprecipitation and immunoblotting confirm decreases in (b) Fb1 mRNA (50–60% knock-down) and (c) protein (cell-associated and secreted) in siRNA treated Bewo cells. Expression (b) is normalized to unexposed samples cultured for similar time periods (48 or 72H). (d) Mean fusion indices for siRNA-exposed and control cells (error bars represent standard deviations; n = 4 × 5 fields). Cell fusion was assessed using phase contrast microscopy and quantitated using cell fusion indices. All observations were performed at a final magnification of 200× and total nuclei were counted per field using Leica MetaMorph image analyzing software. The number of fused syncytial aggregates and the number of nuclei in each aggregate was counted manually and fusion indices were defined as [(N-S)/T] × 100. N is the number of nuclei in syncytia, S is the number of syncytia, and T is the total number of nuclei counted. The fusion index quantitates the percentage of fusion events in a cell population. Black bars- Fb1 siRNA exposed; hatched bars-control siRNA exposed. Data in (b, d) are representative of three independent experiments performed in duplicate. *p < 0.05 and **p < 0.01 compared to matched siRNA control. Statistical comparisons used Kruskal-Wallis and Mann-Whitney U-testing with (d) or without (b) Bonferroni corrections.

