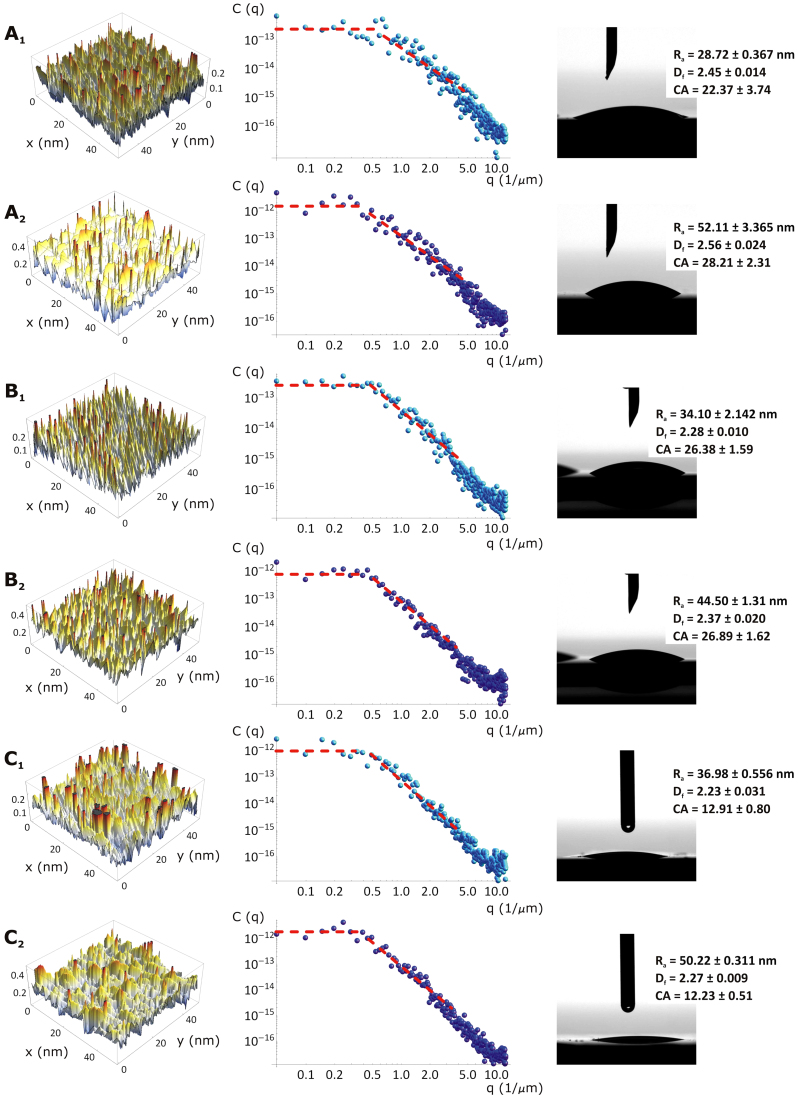
Figure 2. Surface characterization of the six silicon substrates.
(A1–C2) Each line presents the Atomic Force Microscopy surface profile, the power spectrum and the contact angle measurement for a silicon substrate. In the last column, the contact angle (CA) is shown together with the Ra, Df and CA values for each analyzed substrate.

