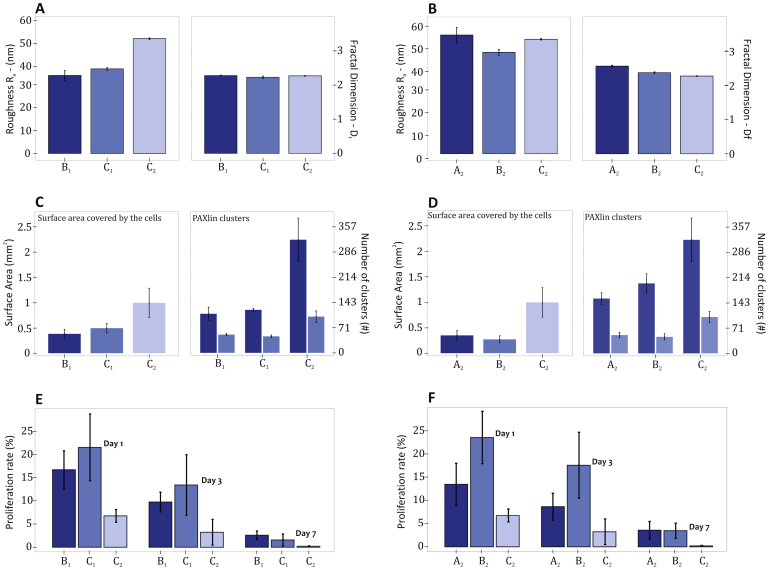
Figure 4. Comparative analysis between silicon substrates with similar topographical features.
The silicon substrates B1, C1 and C2 present similar Df ( = 2.26 ± 0.02) and a different Ra ( = 34.10, 36.98 and 50.22 nm). For these substrates, the variation in topographical features is shown in the inset (A), the variation in adhesion behavior is shown in the inset (C), and the variation in proliferation rates is shown in the inset (E). The silicon substrates A2, B2 and C2 present similar Ra ( = 48.94 ± 3.96 nm) and a different Df ( = 2.56, 2.37 and 2.27). For these substrates, the variation in topographical features is shown in the inset (B), the variation in adhesion behavior is shown in the inset (D), and the variation in proliferation rates is shown in the inset (F).

