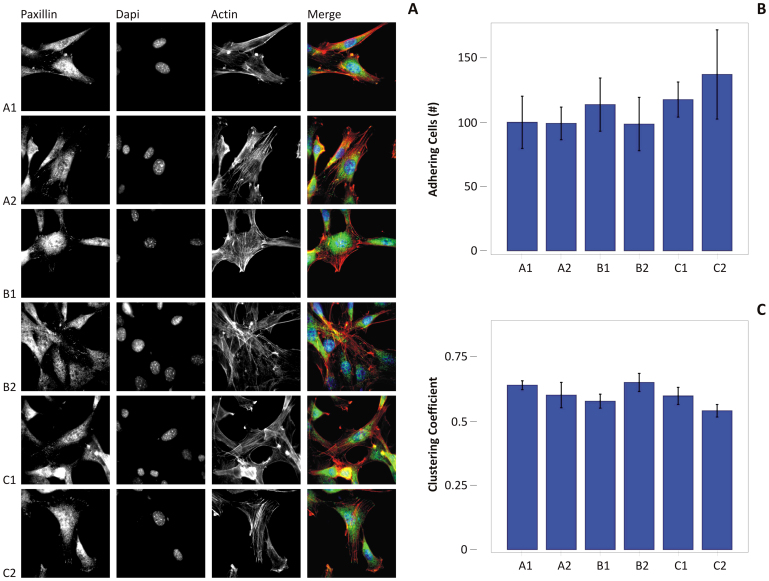
Figure 5. Cell morphological analysis of mouse 3T3 fibroblasts.
(A) A1–C2, Eachline presents fluorescent microscopy images for the 3T3 fibroblasts cultured on the six substrates at day 1 post seeding. The paxillin density and clustering, the nuclear labeling with DAPI, and F-actin staining are shown in the first, second and third column, respectively. The merging of the three images is presented in the fourth column. (B) the number of cells adhering on each substrate 24 hr after seeding was determined by DAPI counting. (C) the clustering coefficient derived from the cells after 24 from seeding.

