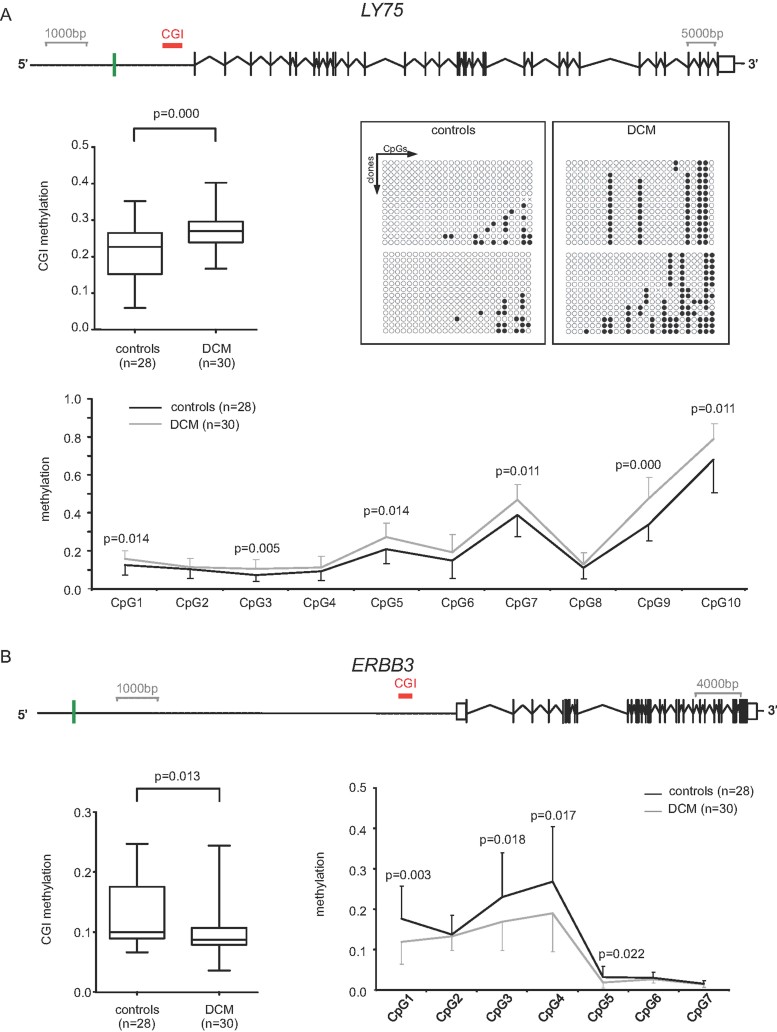
Figure 3. MassARRAY-based validation of differential methylation in LY75 and ERBB3.
DCM patients show significantly increased DNA methylation in LY75 (A), while ERBB3 is significantly lower methylated (B). The schemas above the methylation graphs represent the tested CGI (red lines), in relation to the predicted transcription start-site (green lines), the exons (black bars) and alternatively spliced exons (white boxes) of the genes.
- The box and whiskers plot (min to max) on the upper left side represents the mean CpG methylation measured by MassARRAY, the individual CpG methylation is shown at the bottom. The pattern of CpG methylation in multiple clones is shown on the upper right insert.
- The box and whiskers plot (min to max) on the left side represents the mean CpG methylation measured by MassARRAY, the individual CpG methylation is shown on the right.

