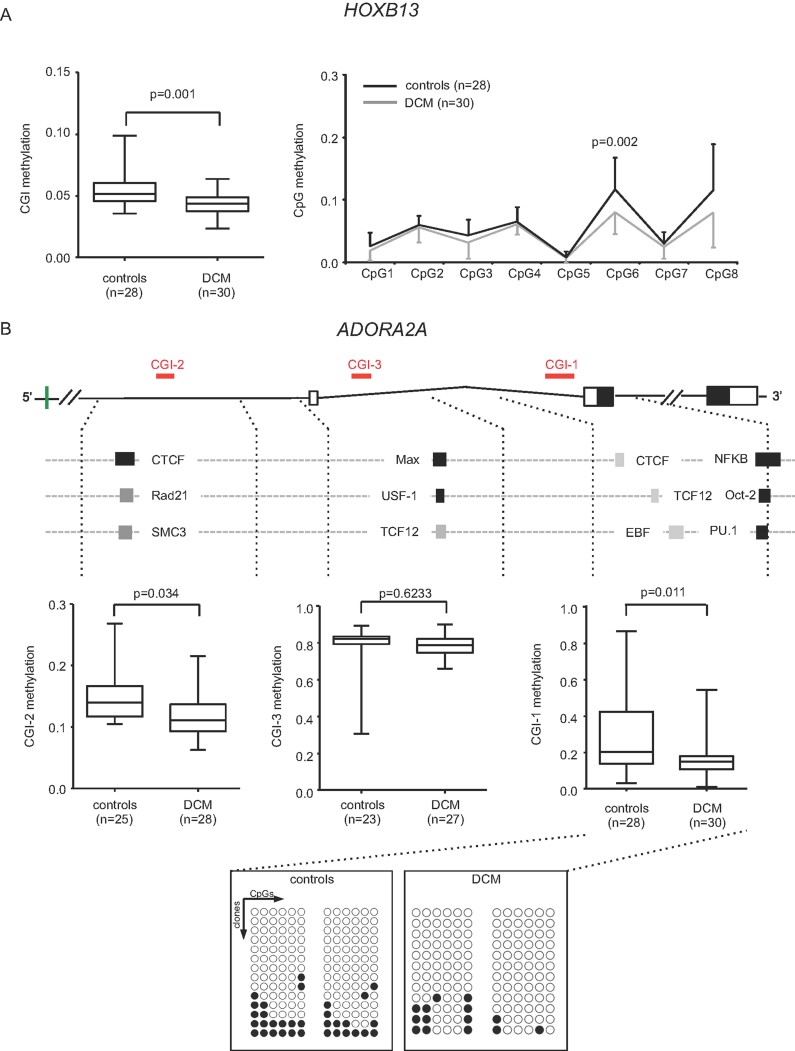
Figure 4. MassARRAY-based validation of differential methylation in HOXB13 and ADORA2A.
DCM patients show significantly decreased DNA methylation in HOXB13 (A) and ADORA2A (B).
- The box and whiskers plot (min to max) on the left side represents the mean CpG methylation measured by MassARRAY, the individual CpG methylation is shown on the right.
- The scheme above the graph represents the tested CGI (red line), in relation to the predicted transcription start site (green line), the exons (black boxes) and alternatively spliced exons (white boxes) of adora2a. Dashed lines indicate the 1500 bp up- and downstream region of the CGIs wherein the listed transcription factor binding sites are found. Boxplots below show the mean methylation in DCM and controls at the corresponding CGI. The pattern of CpG methylation as assessed by bisulphite-sequencing in multiple clones is shown for CGI-1 at the bottom of the figure.

