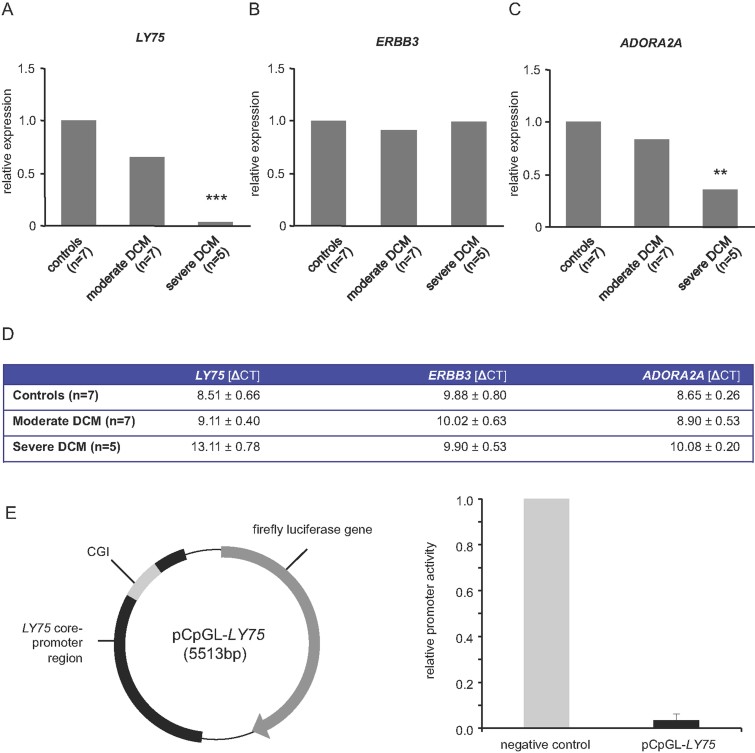
Figure 6. mRNA expression of genes with altered methylation status and gene promoter analysis.
- A–C. Bar graphs showing relative mRNA expression levels of LY75, ERBB3 and ADORA2A in mild and moderate-severe DCM in comparison to controls. (A) LY75 expression is strongly reduced (relative expression = 0.04), while (B) ERBB3 mRNA levels are not differentially regulated. (C) ADORA2A is also significantly down-regulated in DCM (relative expression = 0.37).
- D. Given are the mean delta-CT values (±SEM) of LY75, ERBB3, and ADORA2A in the different groups (controls, moderate DCM, severe DCM). The reference is based on the mean of the three housekeeper genes: GAPDH, RPL13, β-actin.
- E. Left: Schema of the vector construct to measure LY75 promoter activity without and after treatment with the methylase SssI. Right: Relative promoter activity (mean of three technical replicates ± SD) showing the strongly reduced activity in LY75 after methylation, whereas the negative control does not show significant differences.

