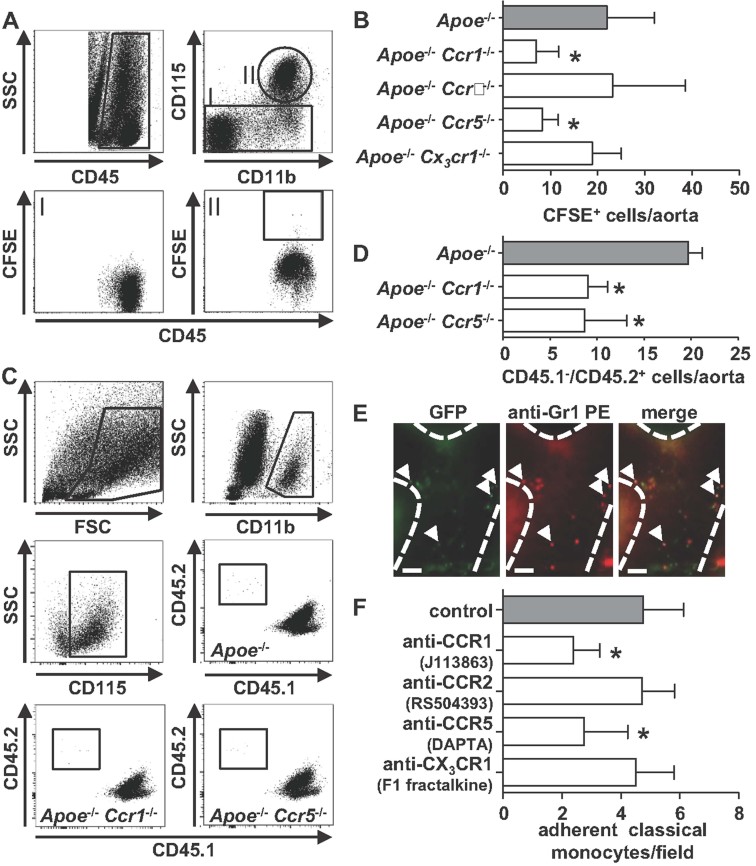
Figure 4. CCR1 and CCR5 mediate arterial classical monocyte infiltration.
- A,B. Classical monocytes (106) of indicated donor mouse strains were injected into Apoe−/− recipients after labelling with the cell tracker CFSE and allowed to circulate for 24 h. Both donor mice and recipients had been on HFD for 8 weeks. Gating strategy (A) and absolute numbers of labeled cells in the aorta quantified by flow cytometry (B) are depicted. *Denotes significant differences compared to injection of classical monocytes from Apoe−/− donor mice. n = 7 for each group (Kruskal–Wallis with Dunns post hoc test).
- C,D. Classical CD45.2+ monocytes (106) of indicated donor mouse strains were injected into CD45.1/Ldlr−/− recipients and allowed to circulate for 24 h. Both donor mice and recipients had been on HFD for 8 weeks. Gating strategy (C) and absolute numbers of CD45.2+ monocytes in the aorta as quantified by flow cytometry (D) are depicted. *Denotes significant differences compared to injection of classical monocytes from Apoe−/− donor mice. n = 7 for each group (Kruskal–Wallis with Dunns post hoc test).
- E. Visualization of leucocyte adhesion to the carotid artery of Apoe−/−Cx3cr1epgf/+ mice having been on HFD for 8 weeks. To discriminate between classical and non-classical monocytes a PE-conjugated antibody to Gr1 was injected. Scale bar = 50 µm.
- F. Quantification of adhesion of classical monocytes to carotid arteries of Apoe−/−Cx3cr1epgf/+ mice having been on HFD for 8 weeks and having received a single dose of indicated chemokine receptor antagonist 1 h prior to experimentation. All data are expressed as mean ± SD. *Denotes significant differences compared to control mice. n = 7–8 (Kruskal–Wallis with Dunns post hoc test) for each group.

