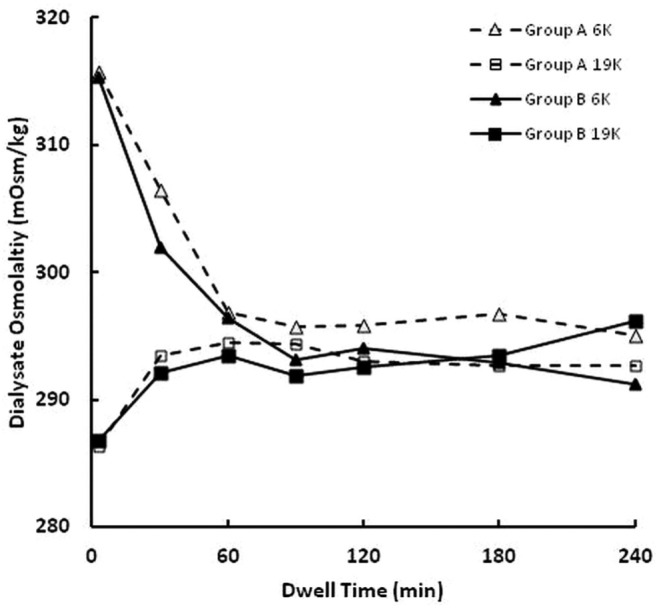
Figure 3.

— Time dependence of dialysate osmolality. Dialysate osmolality was higher for the 6K than for the 19K glucose polymer at 3 minutes and 30 minutes (p < 0.001). The triangles (open = group A; closed = group B) denote results for the 6 K glucose polymer, and the squares (open = group A; closed = group B) denote results for the 19 K glucose polymer. Dashed lines denote group A rabbits (n = 11), and solid lines denote group B rabbits (n = 12).
