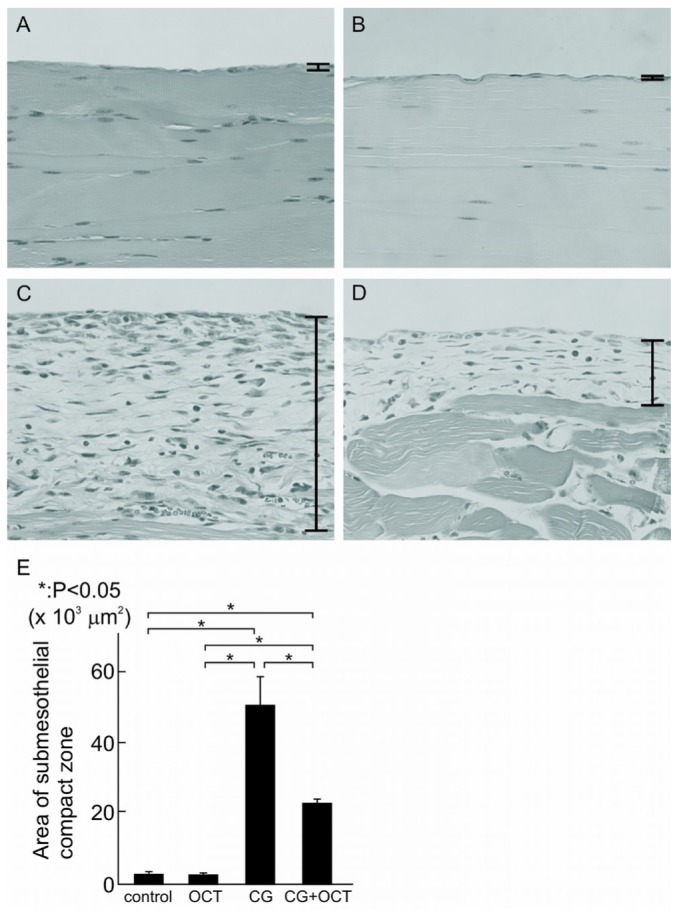
Figure 2.

— Hematoxylin and eosin staining of peritoneal tissues. Histogram comparing the thickness of the compact zone between groups, measured over 10 areas 840 μm in width. Values are expressed as mean ± standard deviation (* p < 0.05). (A) In normal mice, a monolayer of mesothelial cells covered the entire surface of the peritoneum. (B) In the control group, peritoneal tissues were nearly normal. (C) Peritoneal tissues became thickened and fibrotic in the submesothelial compact zone at 21 days. (D,E) 22-Oxacalcitriol (OCT) significantly prevented the progression of submesothelial thickening. (A-D) Original magnification 200×. CG = chlorhexidine gluconate.
