Figure 2.
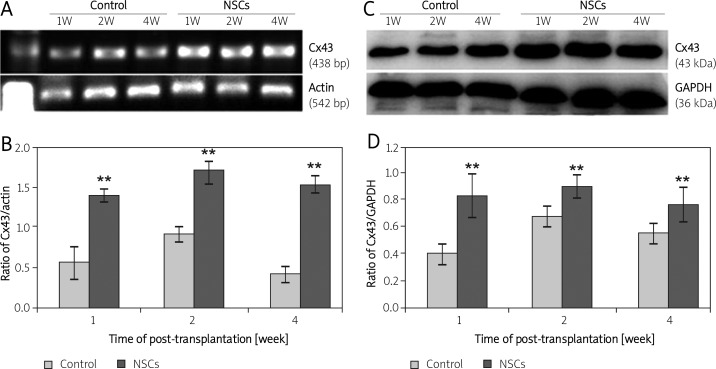
Gene and protein expression of Cx43 in the injured brain. In (A) and (C), lanes 1, 2 and 3 are from control rats and lanes 4, 5 and 6 are from NSCs-transplanted rats. Lanes 1 and 4, 2 and 5, and 3 and 6 are derived from rats at 1, 2 and 4 weeks post-transplantation, respectively. Representative results from semi-quantitative RT-PCR for Cx43 (A) and densitometric analysis of these bands (B). The intensity of each band was standardized to the band intensity of β-actin. Representative Western blots for Cx43 (C) and densitometric analysis of protein bands (D). The intensity of each band was standardized to the band intensity of GAPDH. Data are expressed as the mean ± SD (n = 3 in each group)
* and ** indicate p < 0.05 and p < 0.01 vs. the control group at different time points

