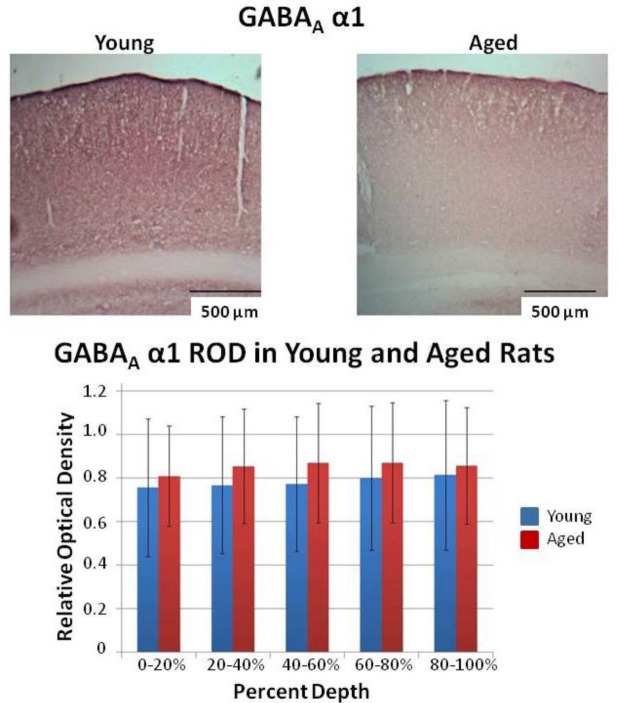
Figure 3.
Example of student quantitation and presentation of immunohistochemical data. Example images from immunostaining of auditory cortex with the GABAA α1 subunit. The bar graph is a summary of average ± SD of the relative optical density of sections of cortex measured as % depth from the cortical surface to the deep white matter. There was a significant difference between young and old animals across all depths (p<0.05, Mann-Whitney test).

