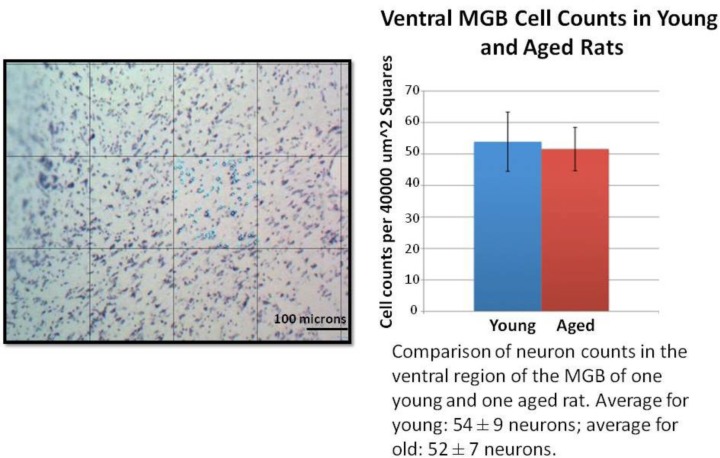
Figure 4.
Example of student quantitation and presentation of neuron counting data in the MGB in young and aged animals. On the left is an example image of Nissl stained ventral MGB with a 200x200 micron grid superimposed on it. The students randomly selected a grid square to analyze and repeated this for multiple sections of tissue/animal. An average neuron count/area was calculated for each animal. The graph on the right is a summary of average neuron counts/ area in young and aged animals (mean ± SD, n=1 animal in each age group) with the student-written figure legend. There was no significant difference between young and aged animals (p>0.05, t test).

