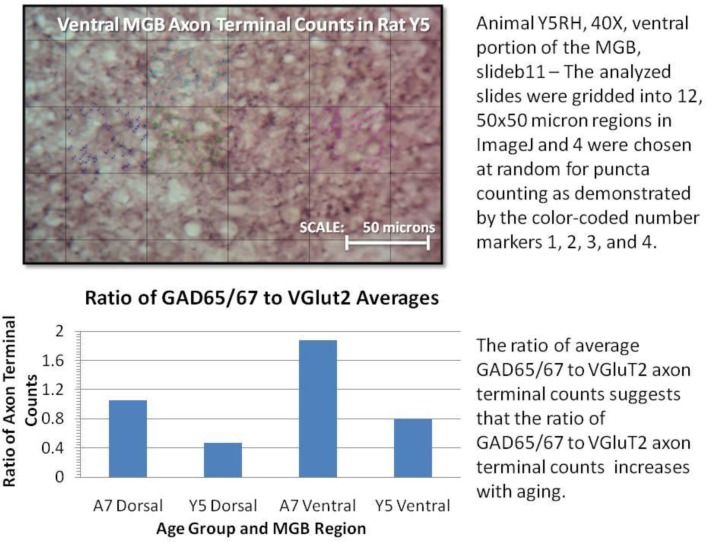
Figure 5.
Example of student quantitation and presentation of VGluT2 and GAD 65/67 axon terminals with student-written figure legends. Students counted puncta from randomly-selected grid squares across multiple tissue sections to get average axon terminal densities. A ratio of the terminal densities was calculated as a means to assess the balance of excitatory and inhibitory inputs to neurons in the MGB in young and aged rats.

