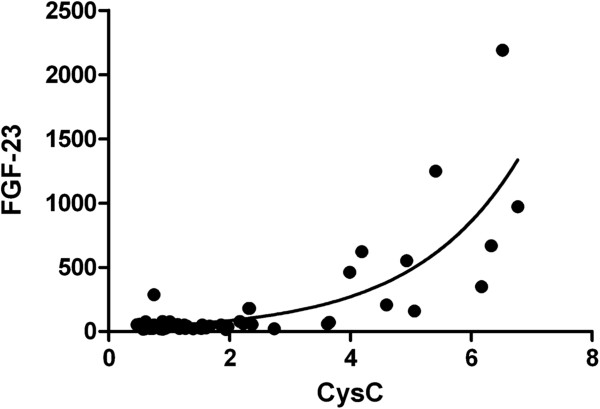
Figure 1.
The relationship between FGF-23 concentrations and phosphate and Ca* P product. There was a significant correlation between FGF-23 and both phosphate (top, Spearman r=0.557, p < 0.0001) and Ca*P (bottom, Spearman r=0.534, p<0.0001) that followed an exponential growth pattern only in the group of patients older than 13 years of age. The exponential model could be described as FGF-23= 29.93 e1.151P in the case of phosphate and FGF-23= 38.15 e 0.4625Ca*P in the case of calcium phosphate product with regression coefficients of 0.8758 and 0.7819, respectively.

