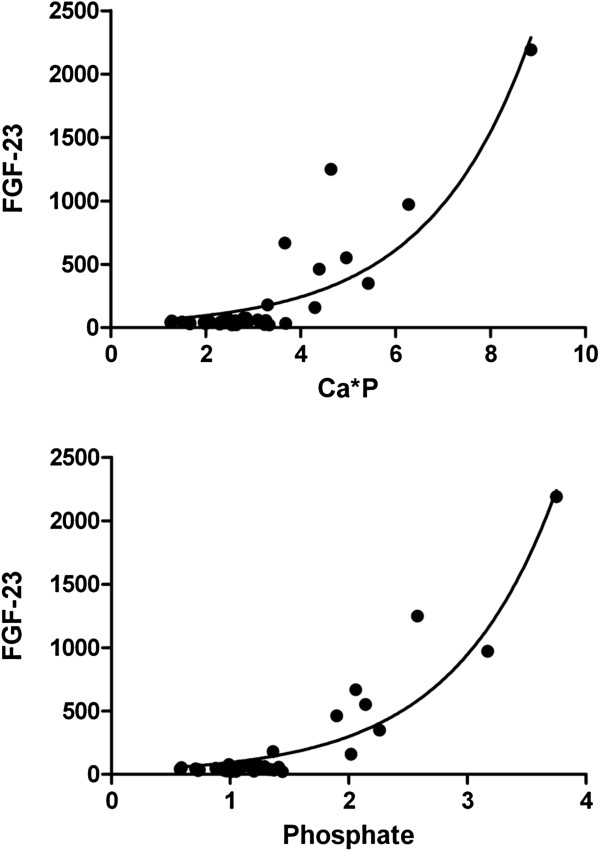
Figure 2.
There was a significant correlation (Spearman r=0.404, p<0.0001) between both markers, FGF-23 and CysC, for the whole group of patients that followed an exponential growth pattern. The exponential model could be described as FGF-23= 27.10 e 0.5759CysC with a regression coefficient of 0.6660.

