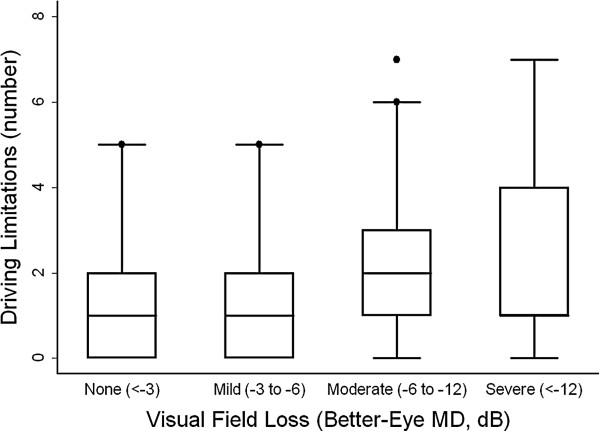
Figure 2.

Number of driving limitations by severity of better-eye visual field loss. Upper and lower limits of box reflect the 75th and 25th percentile values. Median values are shown by the horizontal line within the box, and is not seen for the severe glaucoma group as the median value is the same as the 75th percentile. MD = mean deviation, dB = decibels.
