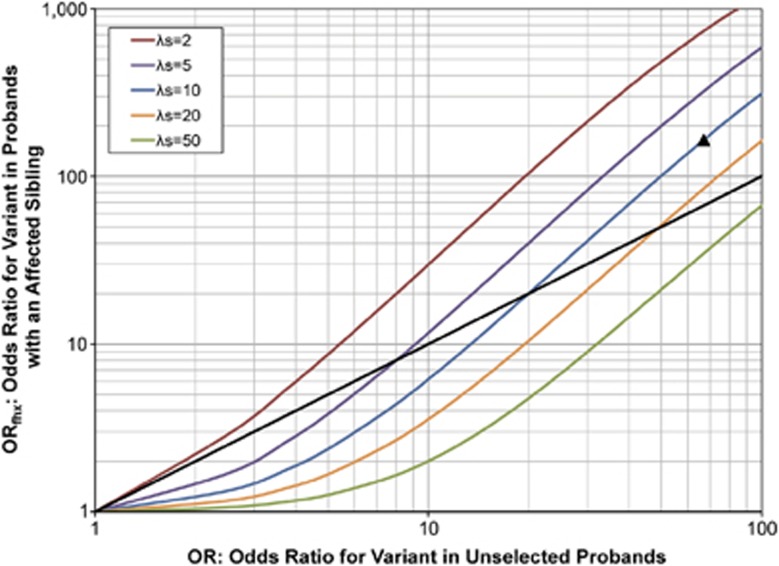
Figure 3.
The expected OR for the variant in cases with an affected sibling vs unaffected controls (ORfhx, y axis), and in unselected cases vs unaffected controls (OR, x axis). Disease assumed to be caused by variants at two loci, G and H, with a penetrance matrix described by Risch's heterogeneity model16 as shown in Table 1b. Population disease frequency assumed to be 0.005 and variant frequency at G locus assumed to be 0.0002. The dashed black line indicates equal ORfhx and OR. The black triangle indicates the expected result for parameters corresponding to the 15q13.3 microdeletion in IGE.

