Figure 3.
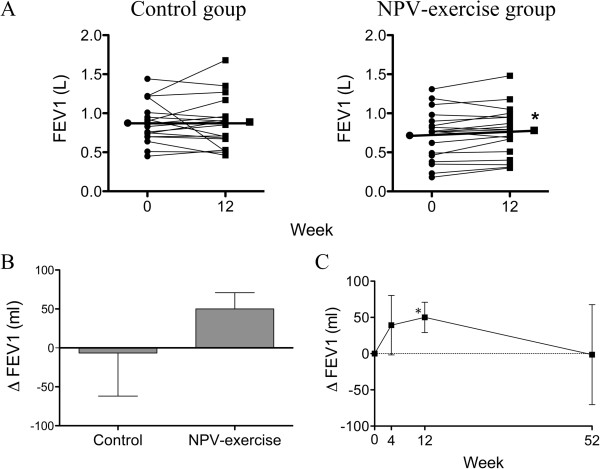
Effects of NPV-exercise training vs. control on FEV1. A. Individual changes of FEV1 in both groups before and after the 12-week course (Control, n = 18; NPV-exercise, n = 18). B. Comparisons of delta-FEV1 (ΔFEV1; changes from the base line after 12 weeks; mean ± SD) between both groups (Control, n = 18; NPV-exercise, n = 18). C. Time course of ΔFEV1 in the NPV-exercise group (n = 14) during the 12 months.

