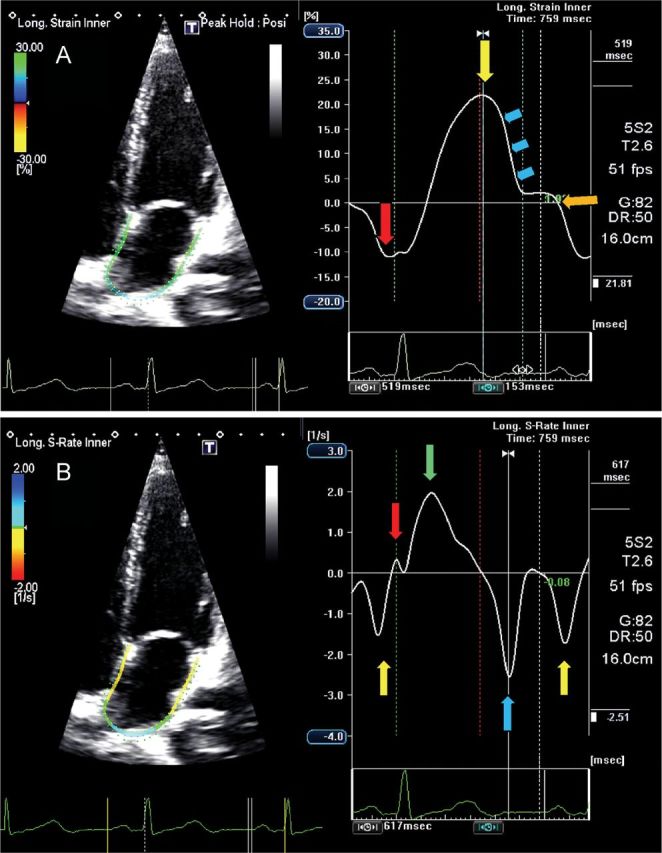
Figure 6.

Four-chamber view showing global left atrial (LA) longitudinal strain (A) and strain rate (B) in a normal subject. The trigger is before the P-wave on the electrocardiogram. (A) The negative peak of the contractile phase (red arrow), the positive peak of the reservoir phase (yellow arrows) and the conduit phase, which includes early diastole (blue arrows) and diastases (orange arrow). (B) The peak of the LA contractile phase in late diastole (yellow arrow), the early (red arrow) and late peak (green arrow) of the reservoir phase during ventricular systole, and the conduit phase in early diastole (blue arrow).
