
Figure 8.
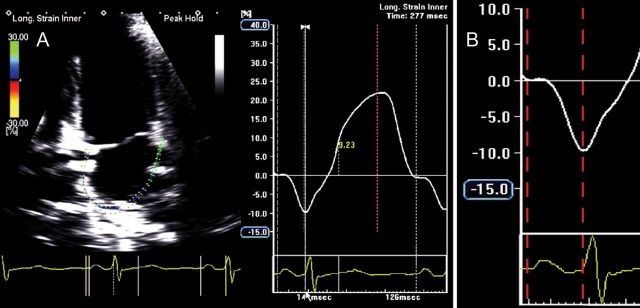
Global left atrial (LA) longitudinal strain (A) and detail of global LA longitudinal strain during the contractile phase (B) showing an atrial electromechanical delay of 126 ms, measured from the onset of the P-wave to the negative peak of the curve, in a normal subject. (Time interval depicted between the two red dotted lines.)