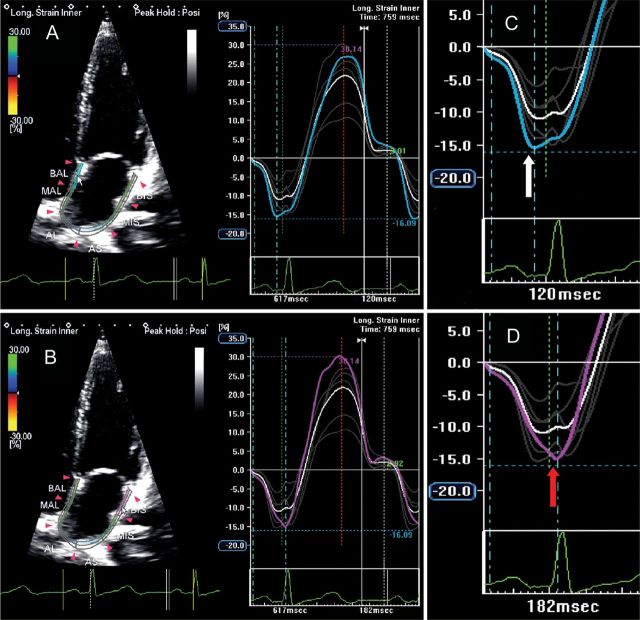
Figure 9.
Two-dimensional echocardiography apical four-chamber view showing left atrial longitudinal strain in a normal subject: the blue line (A) and the purple line (B) represent mechanical deformation of the interatrial septum and the lateral wall. As expected, the negative peak of interatrial septum (C, white arrow) occurs before the negative peak of lateral wall (D, red arrow), showing a delay of 60 ms between the two peaks.

