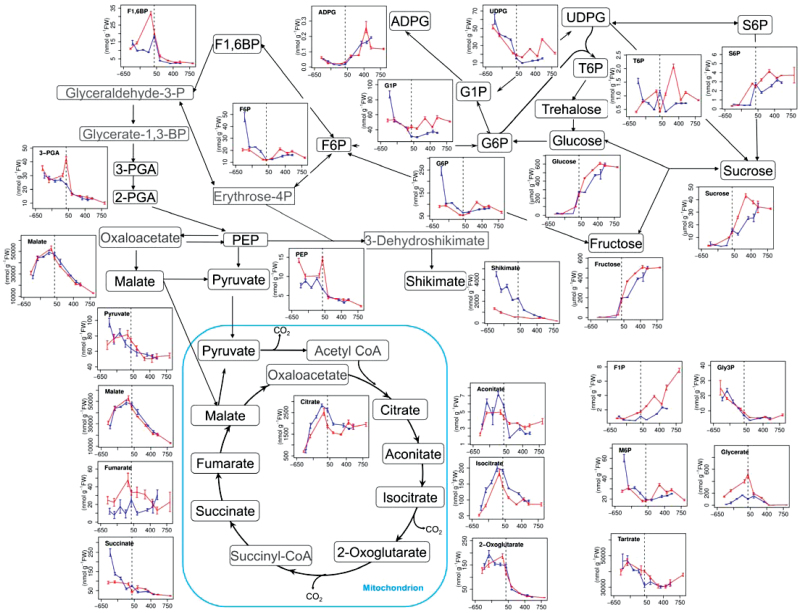
Fig. 1.
Metabolite profiles of berries from vines grown in the vineyard (blue line) or fruit-bearing cuttings grown in the greenhouse (red line). Metabolites are shown in their respective metabolic pathways (sugar metabolism, glycolysis, and the TCA cycle) and their temporal profiles during berry development (µmol g–1 FW for sucrose, glucose, and fructose; and nmol g–1 FW for the others) are presented alongside. For each profile, the x-axis shows the accumulated thermal history of the plants in degree-days, normalized to zero at veraison (indicated by the dashed line) to facilitate comparison between the vineyard- and greenhouse-grown samples.

