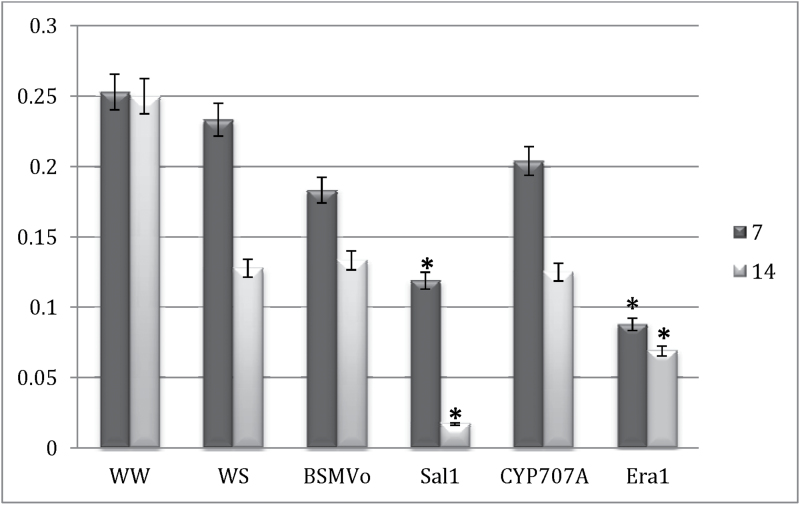
Fig. 2.
Mean stomatal conductance (mmol m–2 s–1) at 7 and 14 dpi. Measurements were taken daily from each treatment group for 14 days. Water-stressed BSMV0-inoculated plants served as control. Values are means of six observations. Asterisks denote significant difference from the control WS (P = 0.05). WW, non-silenced well-watered; WS, non-silenced water-stressed; all others plants were water-stressed and inoculated with BSMV targeted to specific genes.

