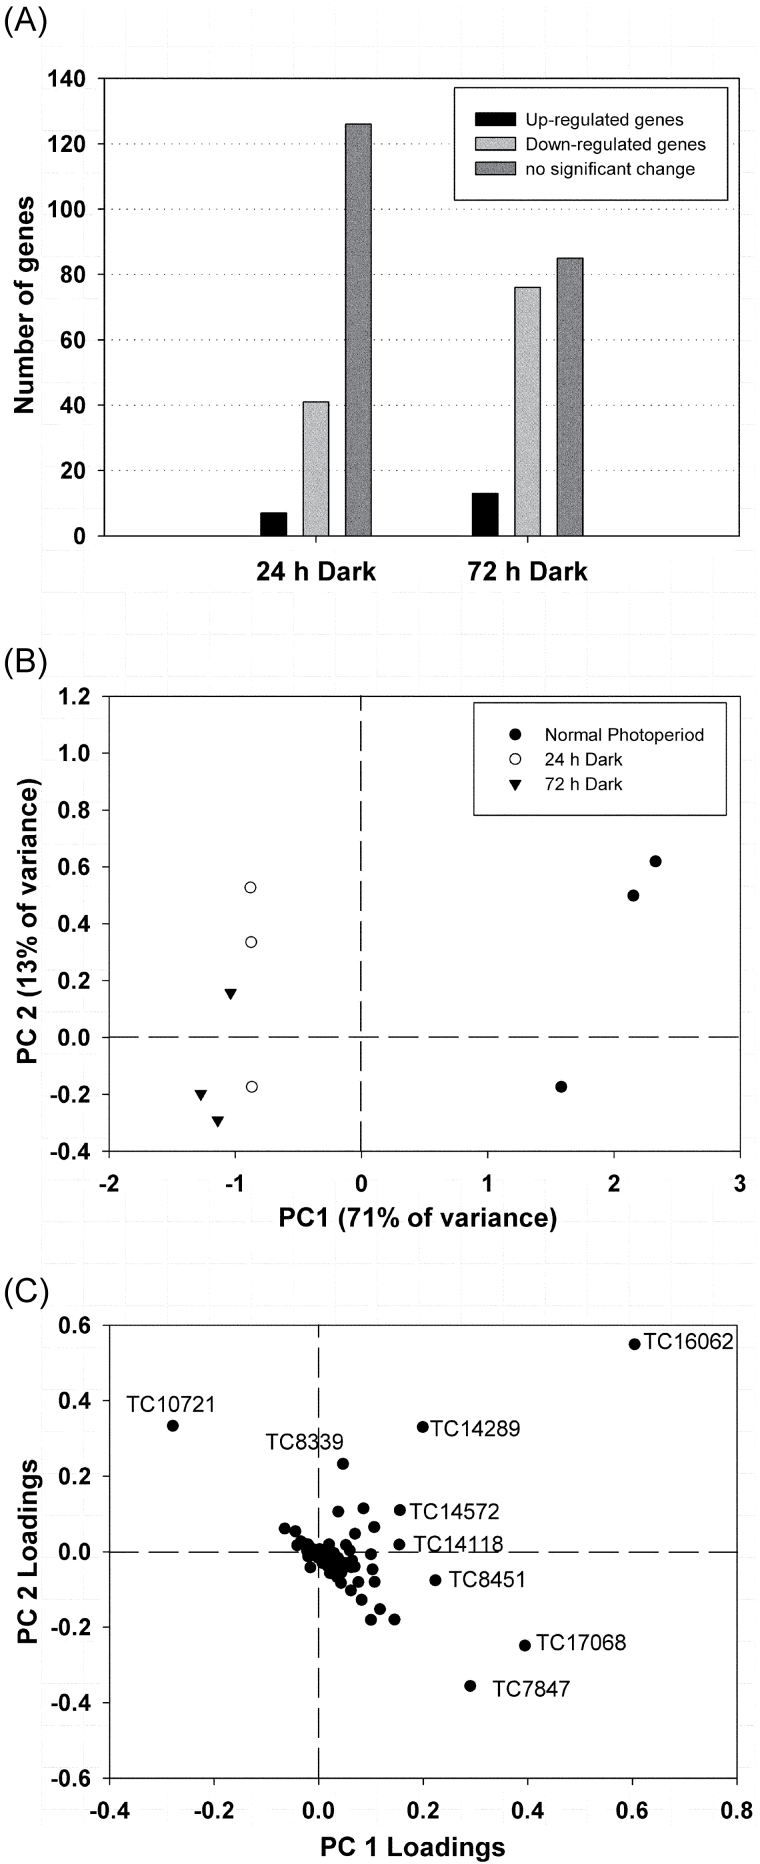
Fig. 3.
Analysis of the gene expression profiling results of L. japonicus nodules harvested from plants grown under a normal photoperiod, and after the plants have been subjected to 24h and 72h of a continuous dark period (n=3). (A) Number of genes showing increased expression levels (ratio dark/normal photoperiod >2, Ρ < 0.05), decreased expression levels (ratio dark/normal photoperiod <0.5, Ρ < 0.05), or unaffected expression levels (Ρ > 0.05). (B) Bi-plot of principal components 1 and 2 representing 84% of the total variance observed in gene expression levels. (C) Loadings of individual gene transcripts showing the highest variability under the studied experimental conditions.

