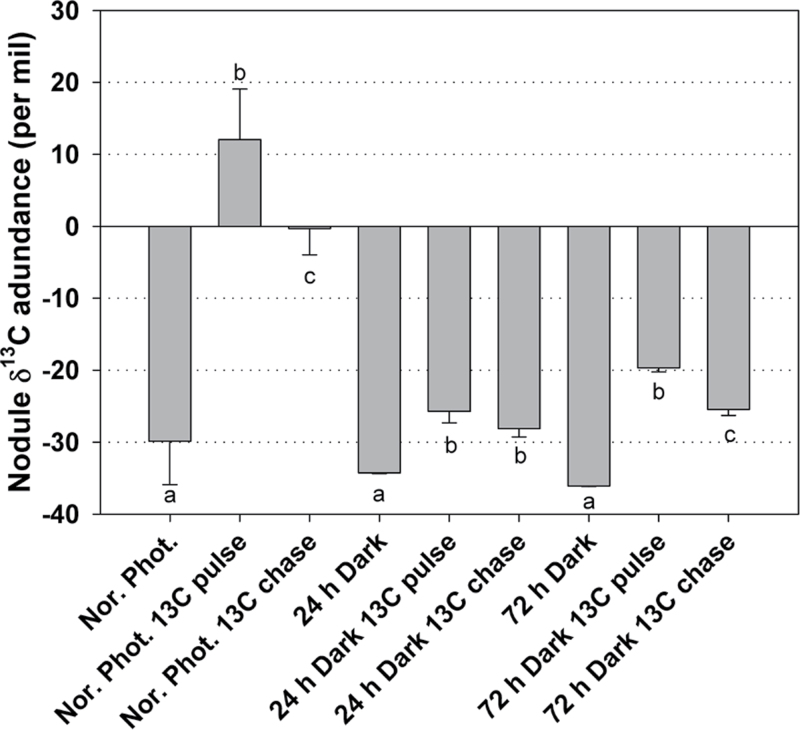
Fig. 4.
δ13C abundance in nodules of L. japonicus plants grown under a normal photoperiod, and after 24h and 72h of continuous dark periods, subjected to 2h of 13C pulse labelling, and 1h of chase after the completion of the 2h 13C pulse labelling. Bars represent means (±SE) of six biological replications (three plants each). Within each light/dark condition, the statistical analysis refers to the comparison between the different labelling treatments. Significant differences (P < 0.05) are indicated by different letters.

