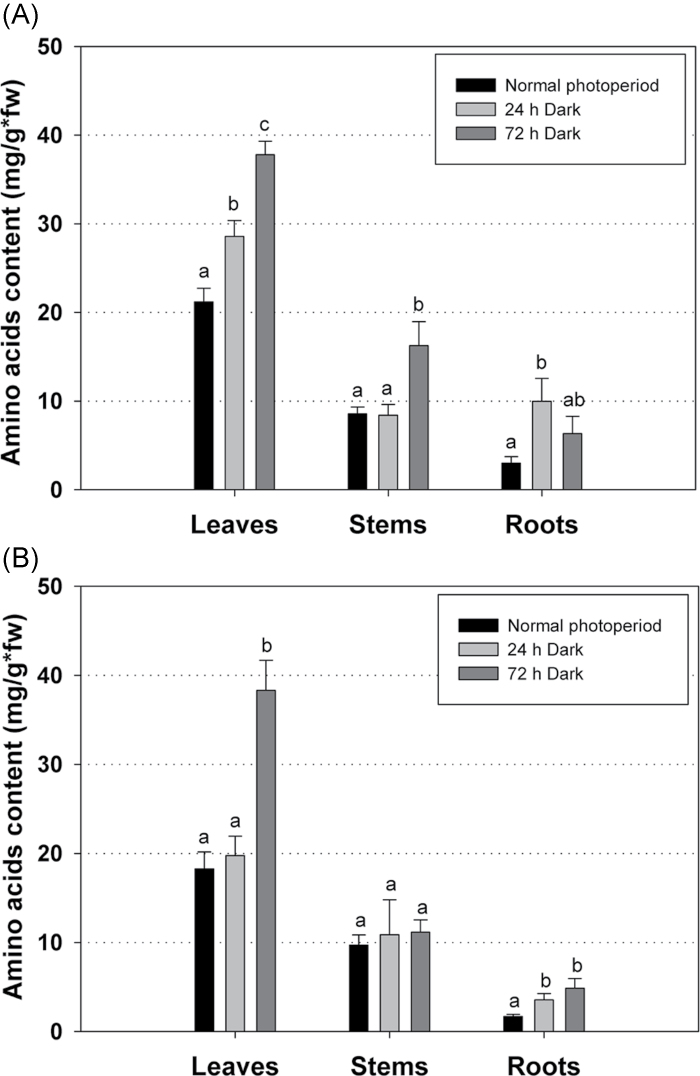
Fig. 6.
Total amino acid content in leaves, stems, and roots of (A) inoculated and (B) uninoculated L. japonicus plants during growth under a normal photoperiod and after 24h and 72h of continuous darkness. Bars represent means (±SE) of four biological replications. Within each graph, the statistical analysis refers to the comparison between the total amino acid content of each organ. Significant differences (P < 0.05) are indicated by different letters.

