Figure 1.

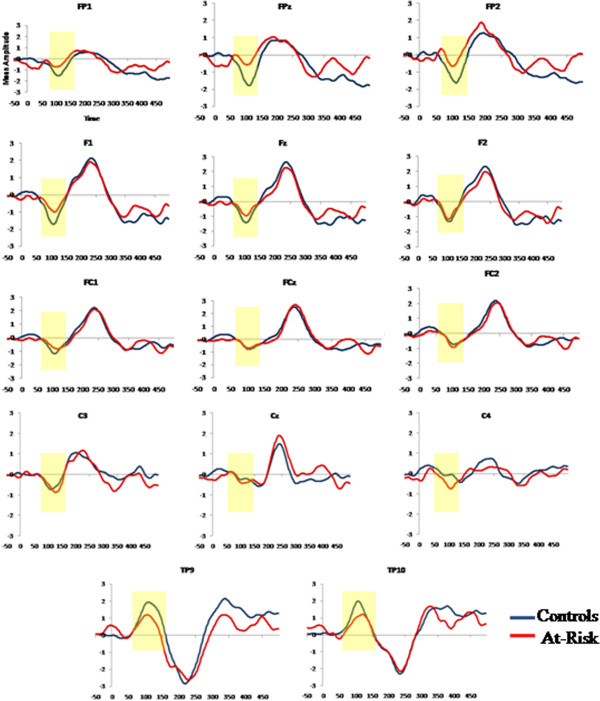
MMN and subsequent P3a activity across frontocentral scalp regions of the controls (blue) and the at risk (red) groups and reversed MMN/P3a polarity at the left and right temporal sites.

MMN and subsequent P3a activity across frontocentral scalp regions of the controls (blue) and the at risk (red) groups and reversed MMN/P3a polarity at the left and right temporal sites.