
Figure 1.
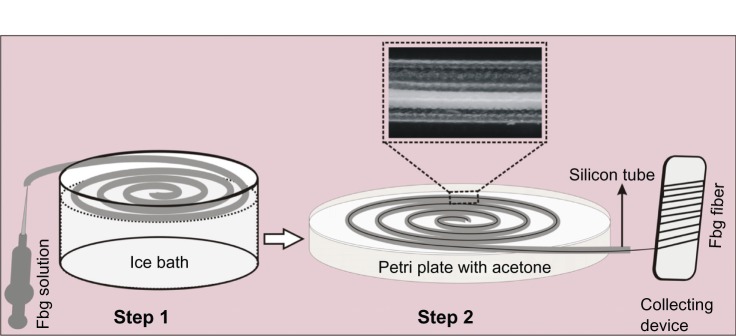
Schematic diagram of the fabrication process for fibrinogen (Fbg) microfibers (inlet: optical micrograph showing fiber formation inside the silicone tube during solvent extraction).
Official websites use .gov
A
.gov website belongs to an official
government organization in the United States.
Secure .gov websites use HTTPS
A lock (
) or https:// means you've safely
connected to the .gov website. Share sensitive
information only on official, secure websites.
Schematic diagram of the fabrication process for fibrinogen (Fbg) microfibers (inlet: optical micrograph showing fiber formation inside the silicone tube during solvent extraction).