
Figure 6.
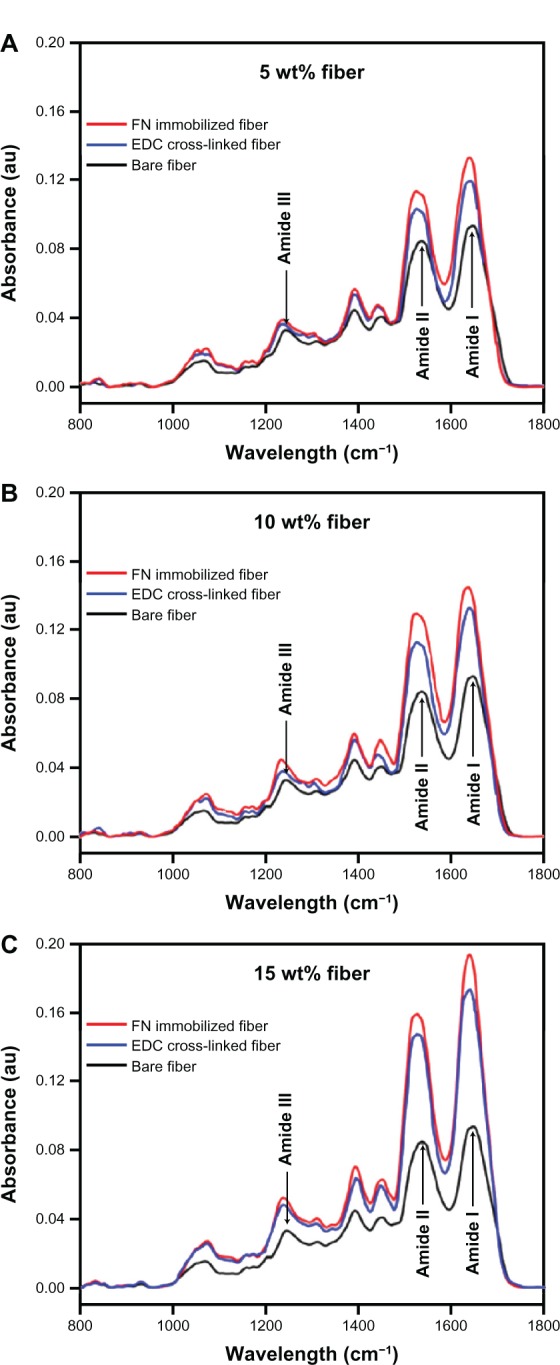
Fourier-transform infrared spectroscopy of fibrinogen (Fbg) microfibers as a function of fibronectin (FN) cross-linking. Images confirm FN immobilization on the Fbg fiber surfaces. The fibers treated with 1-ethyl-3-(3-dimethylaminopropyl) carbodiimide (EDC) only show the peak shifting towards a lower wavelength and higher peak intensity (blue line) compared to bare Fbg fibers (black line), due to the potential cross-linking within Fbg molecules. The FN cross-linked fibers in addition to EDC show a much higher peak intensity (red line) along with peak shifting, which confirms the cross-linking between FN and Fbg. The increase in peak intensity and peak shifting was due to an increasing number of peptide bonds. (A) 5 wt% Fbg fiber; (B) 10 wt% Fbg fibers; (C) 15 wt% Fbg fiber.