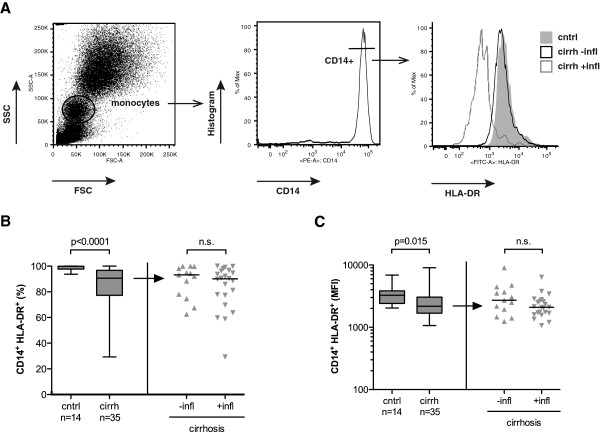
Figure 2.
Monocyte HLA-DR expression on CD14+ monocytes is reduced in cirrhosis. Panel A displays the gating strategy to determine monocyte HLA-DR expression using flow cytometry. Monocytes were identified by forward and sideward scatter (left) and subsequent gating on CD14-positive cells (middle). The overlay histogram (right) demonstrates HLA-DR expression on CD14+ monocytes of three representative individuals from the control group (cntrl, grey area), from the cirrhosis group without inflammation (cirrh –infl, black line) and from the cirrhosis group with inflammation (cirrh +infl, grey line). Panels B and C display distribution and median of fraction of HLA-DR-expressing CD14+ monocytes (B) and of mean fluorescence intensity of HLA-DR+ CD14+ monocytes (C) from healthy controls and patients with cirrhosis (left) and from patients with cirrhosis when stratified for elevated CRP (right). P values in Mann–Whitney U test are indicated; n.s. = not significant.

