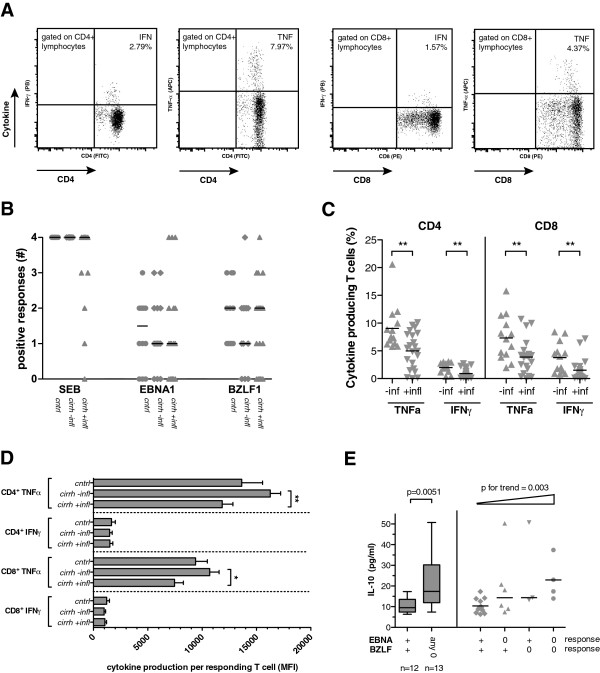
Figure 4.
T cell responses towards the viral antigens EBNA1 and BZLF1 and the superantigen SEB in cirrhosis. (A) Representative plots of intracellular cytokine staining for TNF-α and IFN-γ in T cells after stimulation with SEB. (B) Distribution and median of T cell responses after stimulation with SEB, EBNA1 and BZLF1 in controls (circles), cirrhotic patients without inflammation (diamonds) and cirrhotic patients with inflammation (triangles). A positive response was defined as a cytokine-positive cell frequency of at least 2-fold above background (no antigen control) and the responses for TNF-α in CD4+ and CD8+ cells and for IFN-γ in CD4+ and CD8+ cells were added to a total score of 0 to 4. (C) Median and distribution of reacting CD4 T cells (left) and CD8 T cells (right) after SEB stimulation in cirrhotic patients with and without inflammation (+/−infl). ** indicates P values <0.01 in Mann–Whitney U test. (D) Mean florescence intensity (MFI) and standard error of mean are indicated for the intensity of TNF-α or IFN-γ response in CD4+ and CD8+ T cells after stimulation with SEB. P-values indicate results in Kruskal-Wallis test for each cytokine and T cell subset and asterisks indicate significance level in post-hoc Dunn’s multiple comparison test (* P<0.05; ** p<0.01). (E) Serum IL-10 levels from cirrhotic patients with a null response according to the aforementioned criteria (0) and from cirrhotic patients with at least one cytokine response (+) after stimulation with EBNA1 and BZLF1 are indicated (available from 25 cirrhotic patients). Patients were either stratified for the presence of a null response to EBNA1 or BZLF1 (left; P value in Mann–Whitney U test is indicated) and stratified for the combination of null-responses towards EBNA1 and BZLF1 (right; Jonckheere-Terpstra test demonstrates an increase in IL-10 in patients across the groups).

