
Figure 1.
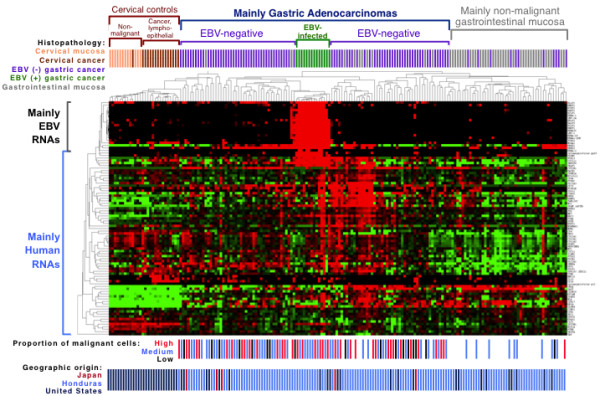
Expression profiles of 182 tissues for 20 viral genes and 73 human genes. A heat map displays unsupervised hierarchical clustering of each tissue in a separate column, and each RNA in a separate row. The data is median-centered with red indicating relative overexpression and green indicating relative under-expression for each gene. Correlative data above the map indicates histopathologic classification with further subclassification of the gastric cancer cohort into 14 EBV infected and 104 EBV negative cancers based on EBV DNA levels. Below the map, each gastric cancer is categorized by the proportion of malignant cells, and geographic origin of each tissue is shown.