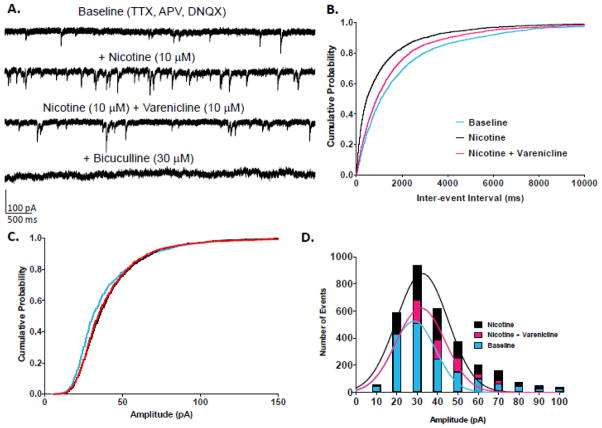
Figure 4.
Effects of nicotine and nicotine plus varenicline on mIPSCs in MS/DB neurons. A.Representative traces from a MS/DB neuron featuring nicotine’s increase in GABA release and varenicline’s subsequent reduction in GABA release measured as mIPSC frequency. B. Cumulative probability plots of nicotine and varenicline’s effects on GABAAR mIPSC IEI from MS/DB neurons (n = 9 cells; number of events over 3 min: baseline = 1688, nicotine = 3155, nicotine + varenicline = 2129). C. Cumulative probability plot of nicotine and varenicline’s effects on GABAAR mIPSC amplitude from MS/DB neurons. D. Histograms and Gaussian curves of mIPSC amplitudes (10 pA bins). Color code: baseline = blue, nicotine = black, nicotine plus varenicline = red.

