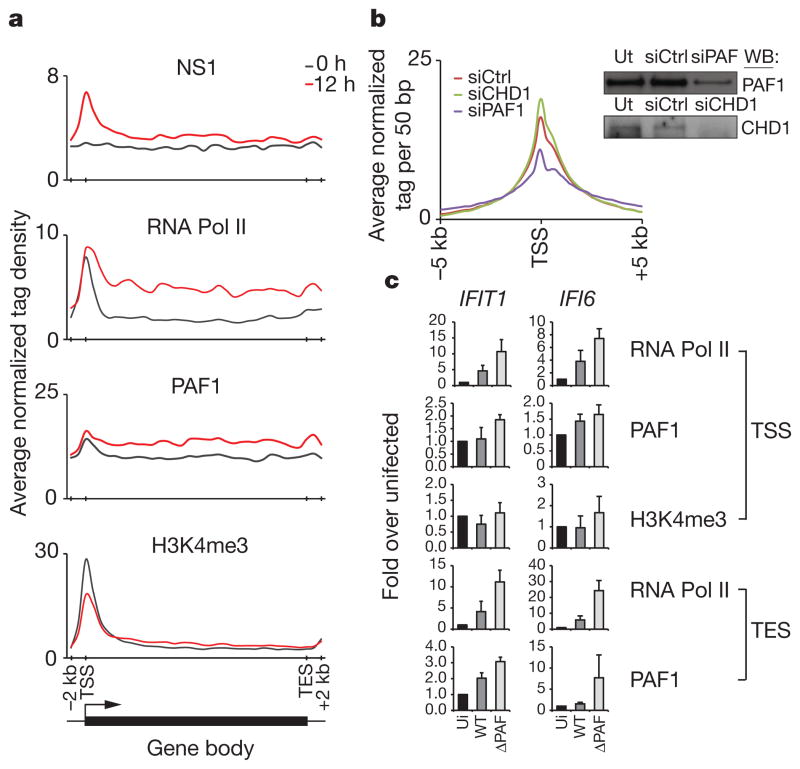
Figure 2. Functional interaction between NS1 and PAF1 in infected cells.
a, The ChIP-seq profiles show the distribution of indicated proteins at inducible genes before (black line) and after (red line) infection. The induced genes were revealed by RNA-seq and ChIP-seq analysis of infected A549 cells (Supplementary Tables 1 and 2). TSS and TES, the transcriptional start and end sites, respectively. b, The NS1 levels at gene promoters in PAF1- or CHD1-deficient cells (blue and green lines, respectively). The scrambled siRNA-treated cells (red line) were used as control. The insert shows knockdown of PAF1 or CHD1 in A549 cells. c, PAF1, RNA Pol II and H3K4me3 levels at the TSS and TES of the induced genes in uninfected (ui) cells, cells infected with the wild-type (WT) or PAF1-binding mutant virus (ΔPAF). Data are representative of three independent experiments; error bars show the s.e.m.

