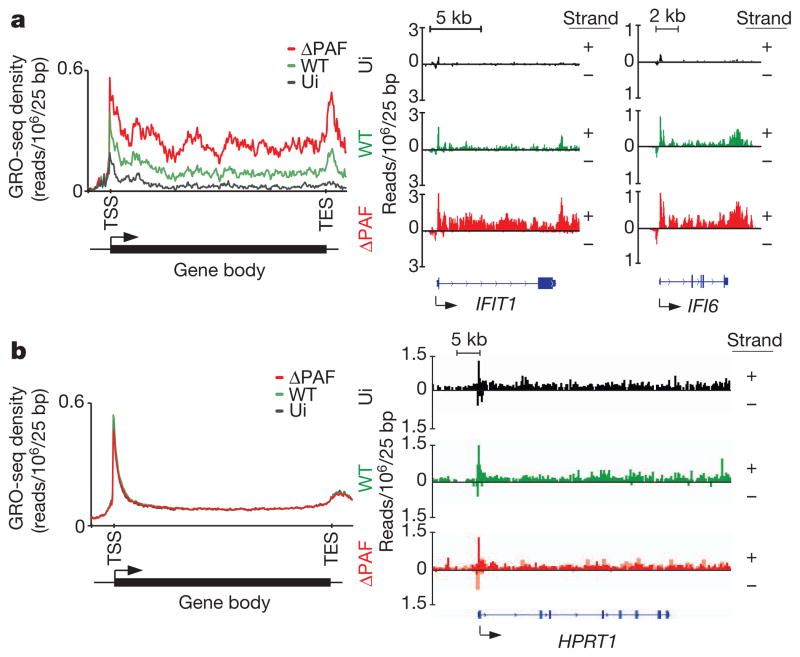
Figure 3. NS1 suppresses antiviral gene transcription in infected cells.
a, Left: the GRO-seq profile of inducible RNA transcripts in uninfected (ui) A549 cells (black line) or cells infected with wild-type or ΔPAF virus (green and red lines, respectively). Right: GRO-seq profile of IFIT1 and IFI6 genes in uninfected and infected cells. b, GRO-seq profile of A549-expressed genes that are not affected by virus infection (left panel) or of the HPRT1 gene (right panel). Reads from either DNA strands are indicated as +/−. The y axes display reads per million mapped reads per 25 bp.

