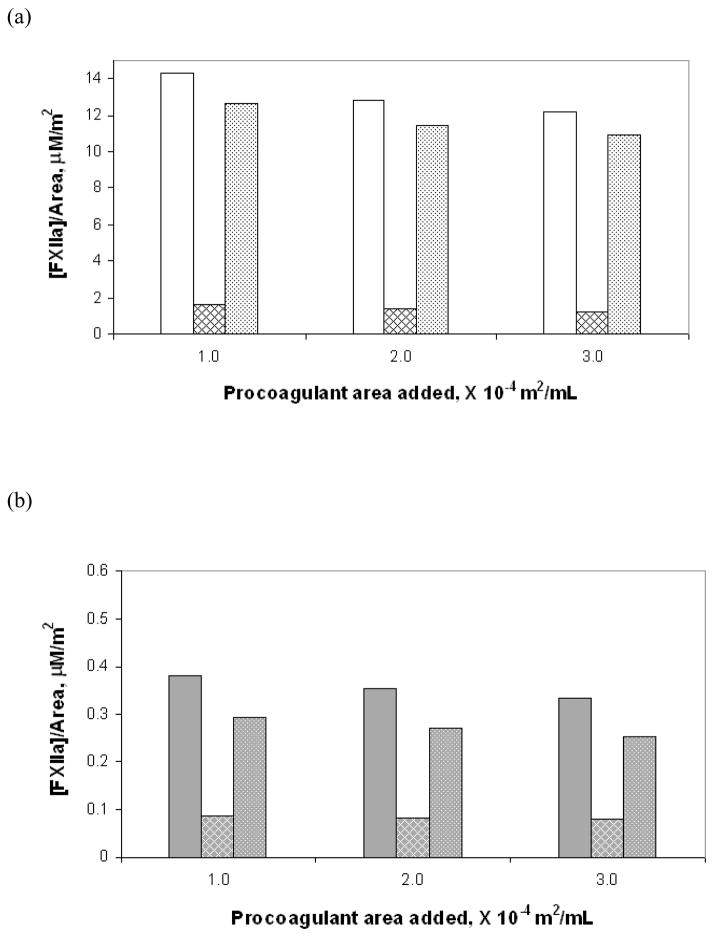
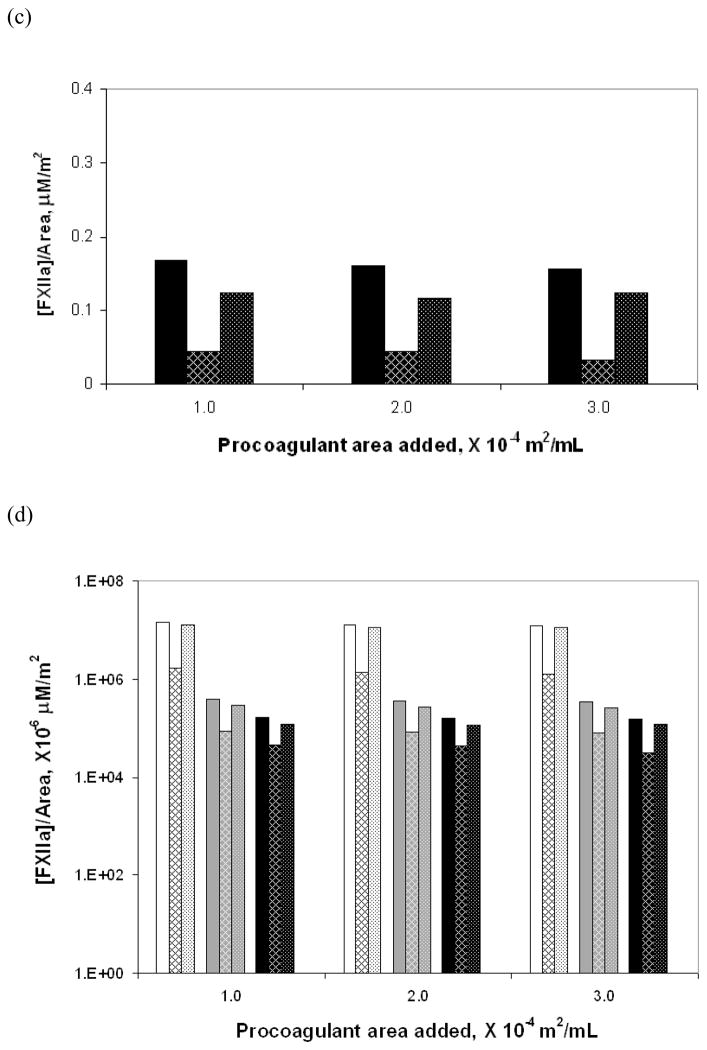
Figure 4.
FXIIa produced per unit surface area in total and via the individual pathways at three surface area values for each of the three solid test procoagulants: (a) glass, (b) APS and (c) OTS. The bars show in groups of three at each surface area the total amount of enzyme (solid bar), enzyme produced by autoactivation (hatched bar) and enzyme produced by reciprocal-activation (dotted bar). (d) is a compilation of values from the different surface presented using a semi-log plot for ease of comparison among the procoagulants showing glass (white background), APS (gray background) and OTS (black background) from left to right at each surface area.


