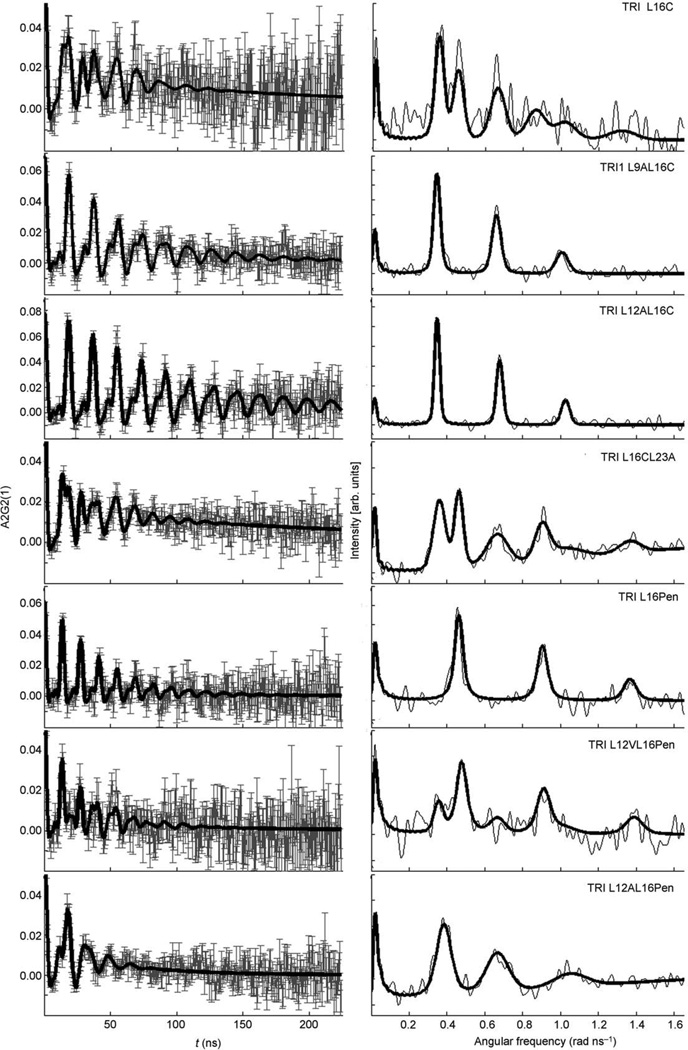
Figure 1.
111mCd PAC spectra of the different TRI peptides. All the samples contained 20 mm TRIS buffer, 300 µm peptide and a CdII/peptide ratio of 1:12. Left: Perturbation function (experimental data with error bars are shown in grey, fit shown as solid line); right: the Fourier transform (the thin line gives the Fourier transform of the experimental data, and the bold faced line gives the Fourier transform of the fit).

