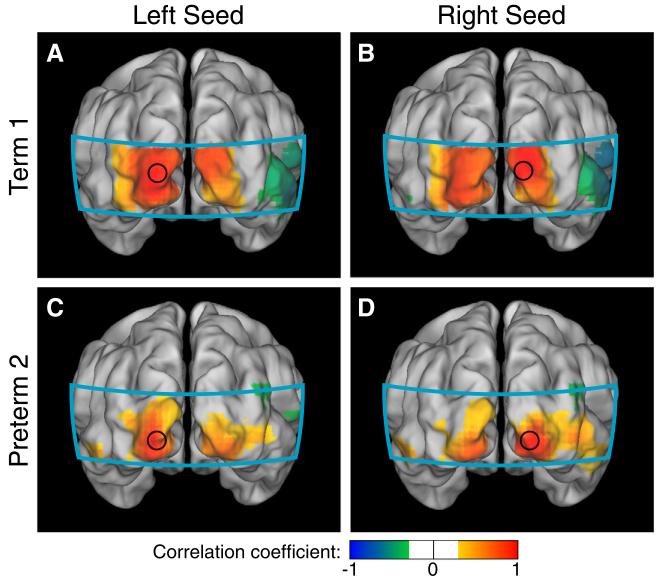
Fig. 2.
Neonatal fcDOT using seed-based correlation analysis in the visual cortex (HbO2). (A, B) Correlation maps using seeds placed in the left and right visual cortices of a healthy term infant. Note the strong ipsilateral and contralateral correlations. (C,D) Correlation maps in a preterm infant with relatively less complicated clinical course, which also show bilateral correlation patterns. (All correlation images are scaled from r=−1 to 1 and have a threshold at |r|>0.3. The area covered by the imaging pad is shown in cyan.).

