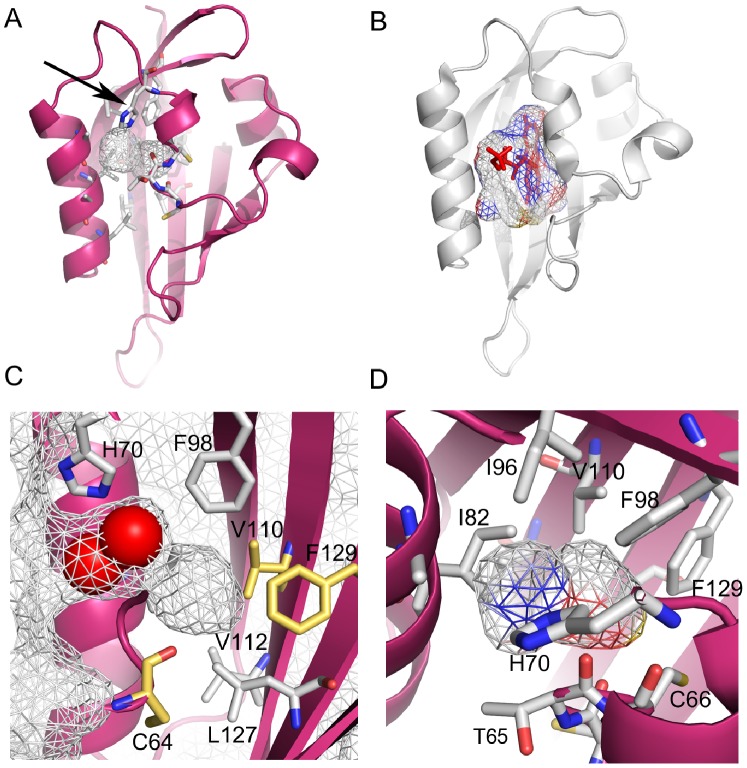
Figure 1. Cavity in the PAS domain of hERG channel.
a) Cartoon representation of high resolution structure of PAS domain from hERG channel. Cavity is shown as wireframe surrounded by several residues shown in stick. Arrow indicates residue H70 at the entrance to cavity. b) PAS domain structure of phototropin Phot-LOV1 (PDB code 1N9N). Flavin mononucleotide, shown as red stick, is bound within binding site cavity, shown as wireframe. c) Detailed view on hERG PAS domain cavity. The molecular surface of the domain is shown as wireframe and extends to the domain cavity. Water molecules in cavity are shown as red spheres. Some of the residues lining cavity are shown and labeled. Residues that in other channel PAS domain are substituted by polar residues are shown in gold. d) Polar and apolar chemical groups lining the cavity of the hERG PAS domain are shown. Wireframe delimiting cavity is colored according to the atoms that compose the cavity lining, red for oxygen, blue for nitrogen and white for carbon; the polar face (predominantly colored red and blue) of the cavity is towards the reader and the apolar face is at the opposite side.

