
Figure 7. Superposition of three (in red, yellow and cyan Cα trace) of the NMR model structures of the hERG PAS domain (PDB code 1L0W).
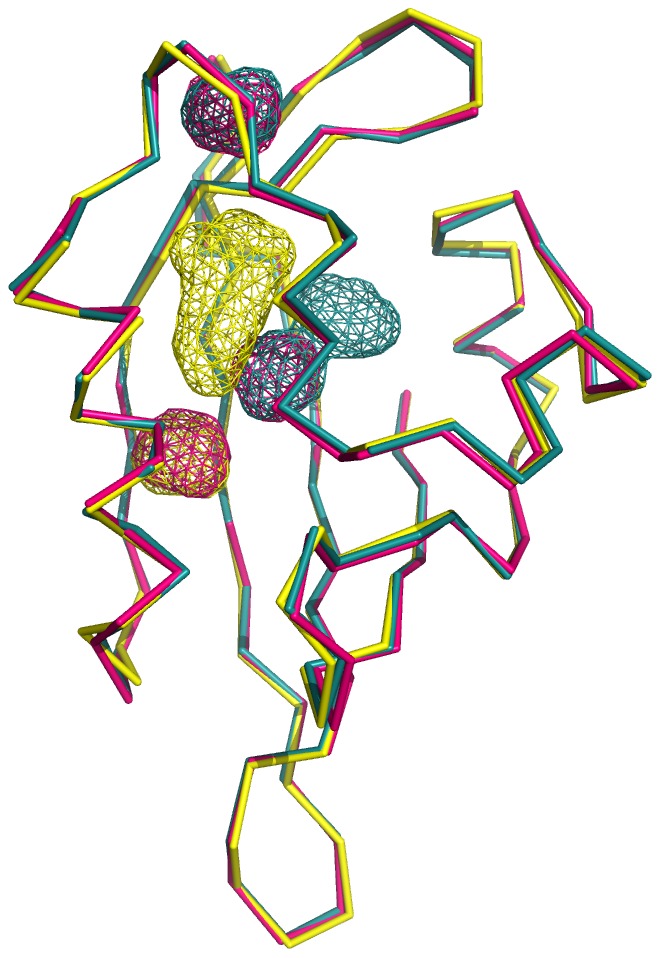
Cavities detected in the three models are shown as red, yellow or cyan wireframe.
Official websites use .gov
A
.gov website belongs to an official
government organization in the United States.
Secure .gov websites use HTTPS
A lock (
) or https:// means you've safely
connected to the .gov website. Share sensitive
information only on official, secure websites.
Cavities detected in the three models are shown as red, yellow or cyan wireframe.