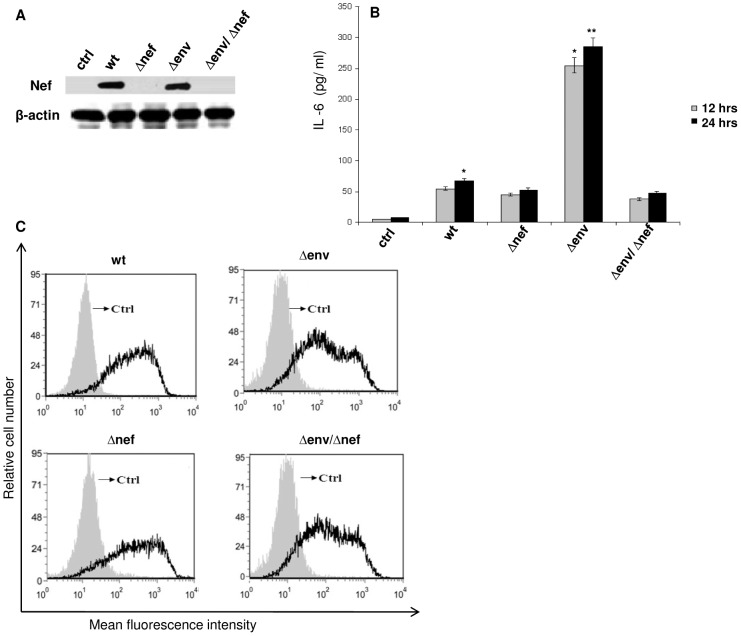
Figure 4. (A) Expression of Nef in the presence of wt, Änef, Äenv, Änef/Äenv (VSV-G) HIV-1 or mock infected immDCs.
The immDCs were infected with the wild type and mutant viruses. After 24 hrs, the cells were harvested and assayed for Nef expression by immunoblotting. â-actin served as an internal control. 4. (B) Nef expressed by HIV-1 induces release of IL-6. The immDCs were infected with either wt, Änef, Äenv, Änef/Äenv (VSV-G) HIV-1. Cells were extensively washed and re-fed after infection. Supernatants were collected at 12 hrs and 24 hrs of infection. The content of IL-6 was then measured by ELISA. Data represent the mean±SEM (n = 3). Statistical analysis was performed using Student's t-test, with the levels of significance defined as p*<0.05 and p**<0.01. 4. (C) Flow cytometry analysis for the detection of infection in immDCs. After 24 hrs of infection with either wt, Δenv, Δnef or Δenv/Δnef were analysed for the detection of the HIV-1 antigen (p24) by incubating with anti-p24 HIV-1 monoclonal antibody followed by staining with PE-conjugated anti mouse antibody. PE-conjugated isotype matched IgG served as control. Presence of histogram peaks evidenced the occurrence of infection and validated our results.

