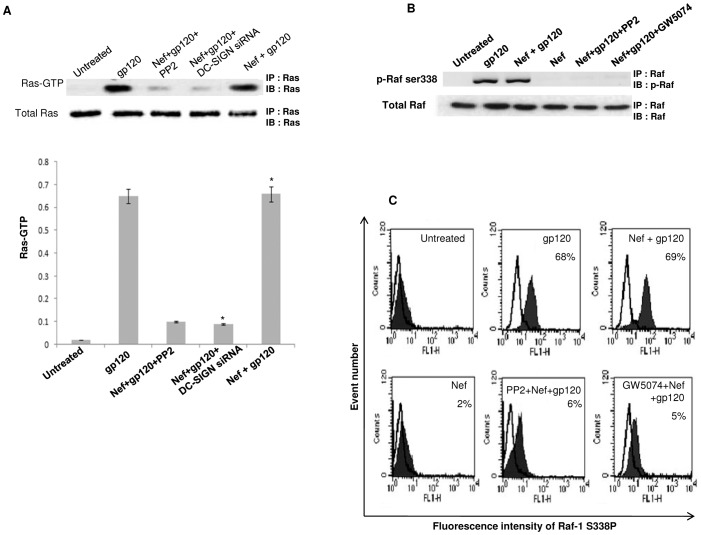
Figure 7. Ras-GTP and Raf-1 activation is required for gp120 to implement its downregulatory effect on Nef induced IL-6.
(A) Immunoblot analysis for the detection of Ras-GTP in immDCs. Ras-GTP activation was measured in presence of gp120; Nef, gp120 and kinase inhibitor (PP2); Nef, gp120 and DC-SIGN siRNA; Nef and gp120. The upper panel of the western blot analysis reveals that Ras-GTP gets activated in the presence of gp120, both in the presence (5th lane) and absence (2nd lane) of Nef. This shows that Nef has no role in the activation process. However, presence of kinase inhibitor (3rd lane) and knock down of DC-SIGN (4th lane) inhibit the activation of Ras-GTP. The lower panel of the blot denotes the total Ras in the cells. The densitometric analysis corresponds to the respective bands obtained in immunoblotting. Data represent the mean±SEM (n = 3). Statistical analysis was performed using Student's t-test, with the levels of significance defined as p*<0.05. (B) Western blot analysis of Raf-1 phosphorylation at ser338 residue in presence of gp120; Nef and gp120; Nef; Nef, gp120 and kinase inhibitor (PP2); Nef, gp120 and GW5074. The upper panel of the blot clearly shows that Raf-1 phosphorylation is facilitated by gp120. The lower panel denotes the total Raf-1 content of the cell. Data represent the mean±SEM (n = 3). (C) FACS analysis of Raf-1 phosphorylation at ser338 residue in presence of gp120; Nef and gp120; Nef; Nef, gp120 and kinase inhibitor (PP2); Nef, gp120 and GW5074 (Raf-1 inhibitor). The percentage on the upper right hand side of each histogram denotes the cell percentage positively stained.

