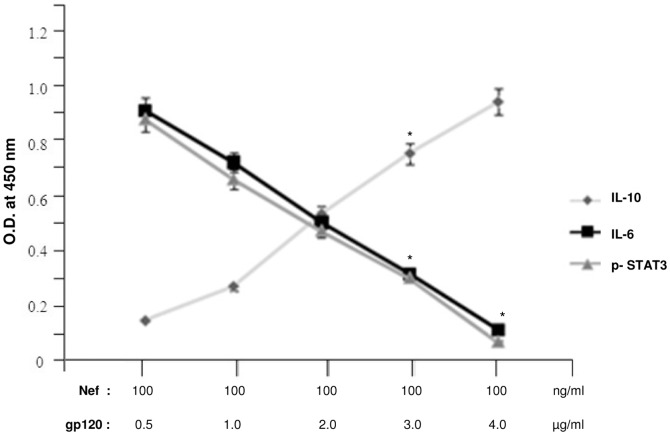
Figure 11. gp120 activates IL-10 in a dose dependent manner unlike IL-6 and IL-6 induced STAT3 phosphorylation which get downregulated.
ELISA analysis showed the increase of IL-10 expression through gp120 in contrast to IL-6 and IL-6 induced STAT3 phosphorylation which exhibited a gradual decrease in concentration depending on the dosage of gp120. The X-axis shows the combined dosage of Nef and gp120, where Nef dosage has been kept fixed at 100 ng/ml and the gp120 dosage has been varied from 0.5 µg/ml to 4.0 µg/ml. The Y-axis denotes the OD obtained at 450 nm. Data represent the mean±SEM (n = 3). Statistical analysis was performed using Student's t-test, with the levels of significance defined as p*<0.05.

