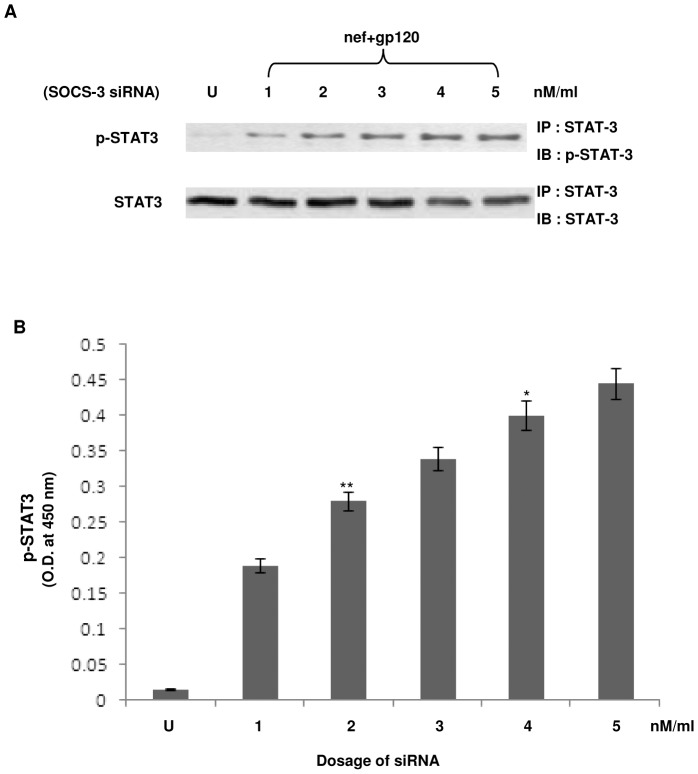
Figure 13. Effect of SOCS-3 silencing on STAT3 phosphorylation in the presence of Nef and gp120.
(A) Western blot analysis denotes the phosphorylation status of STAT3 on subjecting immDCs incubated with Nef+gp120 to SOCS-3 siRNA in a dose dependent manner. The upper panel refers to p-STAT3 whereas the lower panel denotes the total STAT3 in immDCs. ‘U’ refers to untreated cells and 1–5 denote the dosage of SOCS-3 siRNA in nM/ml. (B) ELISA analysis of p-STAT3 under the same conditions. The X-axis denotes the dosage of SOCS-3 siRNA and the Y-axis denotes the OD obtained at 450 nm. Data represent the mean±SEM (n = 3). Statistical analysis was performed using Student's t-test, with the levels of significance defined as p*<0.05, p**<0.01.

